
Khan Capitals | June 2026
Key Takeaways
- A framework, not yet a settlement. The US Iran peace deal took shape around a fourteen-point memorandum of understanding signed on 17 June, followed by quadrilateral talks at Burgenstock that produced a roadmap towards a final agreement within sixty days. The political architecture is in place; the technical detail is not.
- The risk premium has been priced out. Brent fell roughly seventeen dollars across four sessions and traded below 74 dollars on 24 June, its lowest since late February. West Texas Intermediate slipped under 70 dollars for the first time since early March.
- The peace trade is asymmetric. Oil and defence equities have surrendered most of their war premium, equities firmed and the dollar eased, yet gold has held near record levels rather than unwinding in sympathy.
- Hormuz is reopening, but not yet normal. More than twenty tankers have transited the strait since the agreement, while daily transit counts remain volatile and de-mining and de-confliction work is incomplete.
- Delivery risk dominates from here. Sanctions relief faces an unconvinced US Congress, the Lebanon de-confliction mechanism is untested, and the hardest nuclear questions, enrichment and the highly enriched uranium stockpile, remain open.
Part of: The 2026 Iran Crisis – Khan Capital’s hub on the 2026 Iran crisis and oil shock.
The US Iran Peace Deal and the Collapse of the War Premium
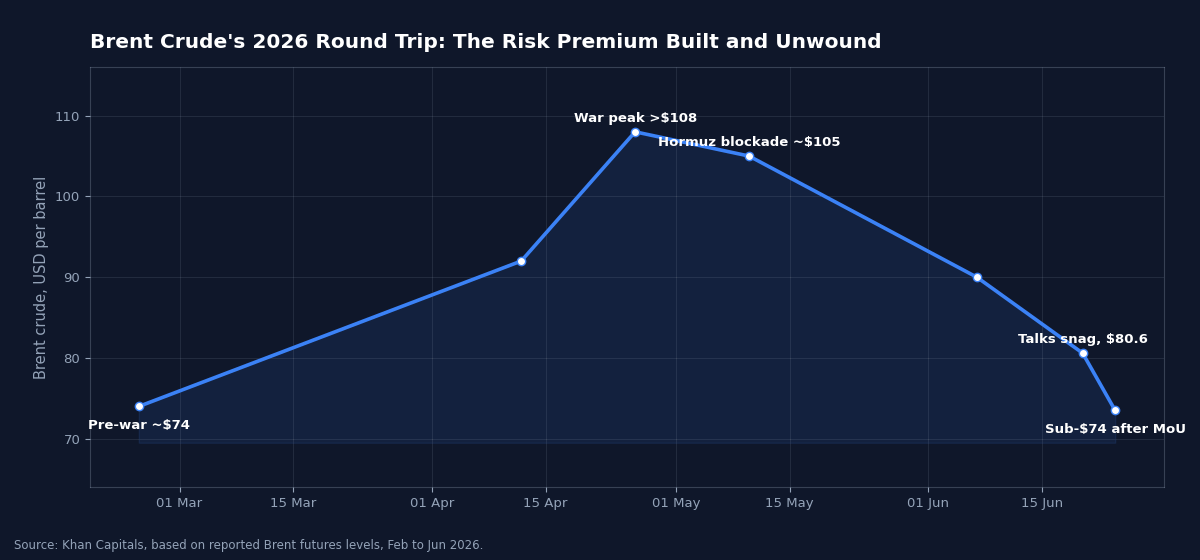
For two quarters, the dominant input into global risk pricing was a war. The US Iran peace deal that emerged over the week of 15 June 2026 has, in the space of a few sessions, begun to remove that input. The mechanics matter for investors because the sequence was not a single clean announcement but a staged de-escalation. A fourteen-point memorandum of understanding was signed on 17 June, establishing a framework for a sixty-day negotiating period and committing both sides to extend the ceasefire across all theatres, including Lebanon, and to work towards reopening the Strait of Hormuz. A planned signing ceremony at the Burgenstock resort near Lucerne was disrupted on 19 June when the Swiss talks failed to proceed as scheduled, a snag that briefly pushed Brent back above 80 dollars. Quadrilateral talks involving the United States, Iran and the mediators Qatar and Pakistan then resumed on 21 June, and after an eighteen-hour session the parties announced a roadmap towards a final deal within sixty days.
That staging is the story for markets. What has been agreed is a political foundation and a set of communication channels: a high-level committee to oversee mediation, a de-confliction cell for Lebanon, and a dedicated line on the Strait of Hormuz intended to ensure safe passage for commercial vessels. What has not been agreed is the substance that determines whether the framework holds: the timeline for sanctions relief, the scope of international inspections, and the fate of Iran’s enriched uranium. The market reaction has run well ahead of that distinction, treating a foundation as if it were a finished structure. For readers who followed our earlier coverage of the Hormuz blockade as it entered its second month, the speed of the reversal is the most striking feature of the episode.
From $108 to Sub-$74: The Oil Round Trip
The cleanest expression of the unwind is in crude. At the height of the conflict in late April, Brent traded above 108 dollars a barrel, and through the blockade phase it held a plateau around 105 dollars as a fifth of seaborne oil and gas faced an uncertain passage. The de-escalation has reversed that move almost in full. Brent fell by roughly seventeen dollars over four trading sessions and dipped below 74 dollars on 24 June, its weakest level since late February. West Texas Intermediate closed at 70.34 dollars the same day after touching 69.63 dollars intraday, the first print below 70 since 2 March. By the following session, the oil complex had effectively erased its wartime gains.
Three supply signals drove the repricing rather than the headline alone. Kuwait lifted its force majeure declarations, the United States stood down its naval blockade, and tankers began transiting the strait again, with more than twenty vessels carrying around thirty-five million barrels passing through since the agreement. Crucially, vessels resumed sailing with their tracking transponders switched on, a behavioural signal that owners and insurers were pricing a durable opening rather than a temporary lull. This supply-led easing arrives on top of the incremental barrels from the OPEC+ July decision, a dynamic we examined when the OPEC production increase met the peace trade. The combination of returning Gulf barrels and scheduled OPEC+ additions into softening demand expectations is what has taken the price below its pre-war anchor.
The Peace Trade Across Assets
The de-escalation has not produced a uniform risk-on response. It has produced a rotation out of the assets that carried the conflict premium and a more nuanced reaction elsewhere. Equities firmed, with S&P 500 futures adding around 1.2 per cent on the clearest deal signals, as a lower oil price fed directly into softer headline inflation expectations and, by extension, a less restrictive path for monetary policy. The dollar eased modestly, slipping to a ten-day low, as the safe-haven bid that had supported it through the conflict faded. Defence equities went the other way: Lockheed Martin fell around four per cent in a single session and sits roughly seventeen per cent lower over ninety days as the market re-rates near-term weapons demand. Gold is the outlier, holding near record levels rather than selling off, supported by a weaker dollar and lower real-rate expectations even as the geopolitical bid recedes.
| Asset | Level (late June) | Direction since MoU | Primary driver |
|---|---|---|---|
| Brent crude | Below $74 | Down ~$17 over four sessions | Hormuz reopening, returning Gulf barrels |
| WTI crude | $70.34 | First sub-$70 since 2 March | Same supply easing, OPEC+ additions |
| Gold (spot) | Near record (~$4,300) | Resilient, modest gains | Weaker dollar, lower real-rate path |
| S&P 500 futures | Higher | Up ~1.2% on deal signals | Lower oil, softer inflation read |
| US dollar (DXY) | 10-day low | Modestly weaker | Fading safe-haven bid |
| Lockheed Martin | Under pressure | ~ -4% on session, -17% over 90 days | Re-rating of near-term weapons demand |
The asymmetry is the point. A genuine, broad-based unwind of risk would normally take gold lower alongside oil and defence. Its failure to do so suggests the market is distinguishing between two different things that the conflict had bundled together: an acute geopolitical risk premium, which is being removed, and a structural bid for real assets driven by fiscal trajectories, central-bank accumulation and a less restrictive monetary outlook, which is not. That distinction was the foundation of the framework we set out in the 2026 geopolitical portfolio, and the current tape is testing which of its three pillars were tactical and which were structural.
A Normalised Strait of Hormuz and the Inflation Channel
For the global macro picture, the most consequential element of the agreement is the conditional reopening of the Strait of Hormuz. Roughly a fifth of the world’s oil and gas passes through the waterway, and its de facto closure during the blockade was the mechanism that turned a regional conflict into a global energy and inflation shock. A normalised strait reverses that transmission. Lower crude prices flow through to retail fuel and, with a lag, into headline inflation prints across importing economies. The effect is most direct where energy carries a heavy weight in the consumer basket and where the pass-through from wholesale to pump prices is fastest.
The policy implication is where this becomes interesting for cross-asset investors. A sustained fall in oil eases the headline inflation impulse that had complicated the monetary debate through the spring, a debate we traced when the conflict and the Bank of Japan collided in the twin macro shocks of late April. A lower energy contribution does not resolve underlying core pressures, but it removes one of the more visible upside risks to the inflation path and gives central banks marginally more room. That is the channel through which a Middle East ceasefire becomes a developed-market rates story, and it explains why front-end yields and the dollar softened alongside crude rather than independently of it.
What the Market Is Underappreciating
The pricing implies a high probability that the framework converts into a durable settlement. The structure of the agreement suggests that confidence is running ahead of the evidence. Three gaps are worth holding in view.
First, the delivery gap. As negotiators themselves have noted, the foundation has been laid but the house has not been built. The sixty-day roadmap covers the questions that were deferred precisely because they were hardest: uranium enrichment, the disposition of the highly enriched stockpile, and the modalities of inspection. Independent analysts have cautioned that the technical phase could prove more intractable than the political one and may run beyond its own timeline. Second, the sanctions gap. Tehran has indicated that waivers on energy and petrochemical exports, the release of frozen assets and a reconstruction programme were core conditions, but several of those measures require an unconvinced US Congress to act. A framework that markets read as settled may stall on domestic ratification. Third, the Lebanon gap. The de-confliction cell is the first real test of the ceasefire’s reach, and it operates without the direct participation of the parties expected to implement it on the ground.

The reopening of the strait is itself less complete than the price action implies. Transit counts have been volatile, with reported daily crossings swinging sharply from one day to the next, and the waterway still requires de-mining before traffic can be considered fully normal. The market has priced the destination; the journey is only partly travelled. None of this argues that the agreement will fail. It argues that the distribution of outcomes is wider than a sub-74-dollar Brent print suggests, and that the premium has been removed faster than the underlying uncertainty has been resolved.
Investor Implications
In equities, the de-escalation supports the broad index through the oil-and-inflation channel while pressuring the assets that carried the conflict bid. Defence names face a re-rating of near-term demand expectations, though the distinction between order books and headlines matters: a multi-year contracted backlog is not erased by a ceasefire, even as sentiment resets. Energy equities face the more direct earnings sensitivity, with a sub-74-dollar Brent compressing the cash-flow assumptions that underwrote the sector through the war. The rotation rewards breadth over the narrow geopolitical leadership of the first half.
In fixed income, the easing of the headline inflation impulse is the cleaner read. A lower energy contribution supports the front end and gives the rates market licence to price a less restrictive path, which is consistent with the softening in yields and the dollar that accompanied the crude move. The risk to that read is that the inflation relief proves shallow if core pressures persist, leaving duration exposed to a hawkish surprise should the supply story stabilise prices rather than push them lower still. Across assets, gold’s behaviour is the most informative signal. Its refusal to unwind alongside oil and defence indicates that the structural bid was never solely a conflict trade. For a portfolio that treated defence, energy and gold as a single geopolitical complex, the current tape is a reminder to separate the tactical premium from the structural one, because they are now moving in opposite directions.
None of the above constitutes advice on any specific position. It is a framework for reading a fast-moving de-escalation in which the market has chosen to price the optimistic tail with considerable conviction.
What to Watch
- The sixty-day roadmap (by mid-August 2026): whether the framework converts into a final agreement within the negotiating window, or the deadline slips as the technical talks drag.
- The nuclear file: progress on enrichment limits, the fate of the highly enriched uranium stockpile, and the scope of inspections, the questions deferred precisely because they are hardest.
- Sanctions ratification: whether the US Congress moves on energy and petrochemical waivers, frozen-asset releases and reconstruction, the steps Tehran has called core conditions.
- The Strait of Hormuz: daily transit counts, the pace of de-mining and de-confliction, and whether tankers keep sailing with transponders on as a sign of durable normalisation.
- Gold versus oil: whether gold holds near record levels while crude stays low, the clearest test of whether the structural real-asset bid outlasts the geopolitical premium.
Conclusion
The US Iran peace deal has done in a week what the conflict took two quarters to build: it has drained the geopolitical risk premium out of crude and, with it, much of the inflation anxiety that had shadowed the monetary debate. Brent’s round trip from above 108 dollars to below 74, the resumption of Hormuz traffic and the easing of the dollar describe a market that has moved decisively to the peace side of the ledger. The asymmetry of that move, oil and defence lower while gold holds, is the most analytically useful feature, because it separates what was a conflict trade from what was always structural. The framework signed in June is a foundation, and the sixty-day roadmap that follows will determine whether it becomes a settlement. The substantive questions of sanctions, inspections and Lebanon remain open, and the gap between a priced-in peace and a delivered one is where the next repricing, in either direction, will originate.
Frequently Asked Questions
Have the US and Iran signed a final peace deal?
Not yet. The two sides signed a fourteen-point memorandum of understanding on 17 June 2026 and, after talks in Switzerland, agreed a roadmap towards a final agreement within sixty days. That is a political framework and a set of communication channels, not a completed settlement; the hardest technical questions remain open.
Why did oil prices fall so sharply after the agreement?
The de-escalation removed the war premium from crude. Kuwait lifted its force majeure declarations, the United States stood down its naval blockade, and more than twenty tankers resumed transiting the Strait of Hormuz, many with their transponders switched back on. Combined with scheduled OPEC+ additions, this supply easing pushed Brent below 74 dollars and West Texas Intermediate below 70 for the first time since early March.
Why has gold held up when oil and defence stocks fell?
Because the market is separating an acute geopolitical risk premium, which is being priced out, from a structural bid for real assets that rests on fiscal trajectories, central-bank accumulation and a less restrictive monetary path. Oil and defence carried the conflict premium and have given it back; gold’s resilience suggests its support was never solely a conflict trade.
What are the main risks to the deal holding?
Three gaps dominate. The delivery gap covers enrichment, the highly enriched uranium stockpile and inspections. The sanctions gap depends on an unconvinced US Congress acting on waivers and asset releases. The Lebanon gap concerns an untested de-confliction mechanism. The Strait of Hormuz is also reopening rather than fully normal, with volatile transit counts and incomplete de-mining.
Sources: Al Jazeera, Key outcomes of Iran-US talks in Switzerland; Al Jazeera, US and Iran agree roadmap towards final deal; CNBC, US crude briefly dips below $70 as tankers transit Hormuz; CNBC, US-Iran accord hits early snag after Swiss talks; Swiss Federal Department of Foreign Affairs, Memorandum of Understanding; Trading Economics, Brent crude oil.
The Khan Capital Brief
Understand what moves markets
Analysis like this, free in your inbox. No spam, unsubscribe any time.
Related Reading: This article extends our running coverage of the 2026 Iran cycle. For the supply-side backdrop, see our analysis of how the OPEC production increase met the peace trade and our account of the Hormuz blockade as it entered its second month. For the macro and monetary backdrop, see the BoJ and Iran oil twin shocks of late April. For the cross-asset framework, see the 2026 geopolitical portfolio of defence, energy and gold, and for the market backdrop that opened the year, see the Q1 2026 market correction. For the inflation data that has since validated this shift, see core PCE at 3.4% and the Fed’s hawkish turn. For how the oil unwind fed into UK rate expectations, see The UK Gilt Market and Starmer’s Resignation. The same unwind reached the metals market: see Gold’s Quiet Bear Market. The unwinding reversed in July, when tanker attacks in the Strait of Hormuz broke the truce. That premium returned in July, as covered in the Strait of Hormuz toll that lasted a day. For the fundamentals, start with how sanctions actually bite. See also OPEC+ and spare capacity.

Leave a Reply