
Khan Capitals | June 2026
Key Takeaways
- Gold has entered a technical bear market almost unnoticed. From an all-time high of $5,595.75 on 29 January, spot gold has fallen to the low $4,200s, a drawdown of roughly 24% that has attracted a fraction of the attention the January melt-up did.
- The fear trade lost to the rate trade. The two pillars of the January peak, a geopolitical panic bid and expectations of Federal Reserve easing, have both been dismantled: a peace framework removed the war premium and the Fed’s shift towards possible hikes raised the opportunity cost of holding metal that yields nothing.
- Perspective matters: gold remains far above where it started. Even after the drawdown, gold trades roughly 30% higher than a year ago, when it closed at $3,318 in early June 2025. This is a violent correction inside a longer advance, not yet a reversal of it.
- The structural bid has not left. The World Gold Council reported net central bank purchases of 244 tonnes in the first quarter, evidence that official-sector accumulation continues through the price decline.
- Gold is now a clean readout of the policy debate. A metal that pays no coupon competes directly with cash yielding over 3.5% and Treasuries near 4.45%; where gold goes next depends less on fear than on whether the Fed’s hike pricing is validated or unwound.
Part of: The Fed’s Regime Change — Khan Capital’s hub on the Fed’s 2026 regime change.
A Gold Bear Market Nobody Announced
The gold bear market of 2026 arrived without a headline. In late January, when spot gold broke $5,000 for the first time and ran to $5,595.75 within days, the move was everywhere: a 113% advance over two years, powered by central bank accumulation, a weakening dollar and a global appetite for insurance against everything at once. Five months later the same metal changes hands in the low $4,200s, more than a fifth below its peak, and the silence is striking. Equity indices at record highs have a way of absorbing the market’s entire attention span.
A drawdown of this size in the world’s oldest store of value deserves more scrutiny than it is getting, because the reasons gold fell say as much about the current regime as the reasons it rose. The January peak was built on two premises: that the world was getting more dangerous, and that the Federal Reserve was finished tightening. By midsummer, markets had unwound both. Understanding that unwind, and what survived it, is the useful work for investors weighing whether this is an exit or an entry.
Anatomy of the Peak: Everything Bid at Once
January’s high was the compression of several years of accumulating anxieties into a single price. Central banks had been buying at a historic pace for years, diversifying reserves away from the dollar. Geopolitical tension was rising towards what would become open conflict in the Middle East by late February. And crucially, the rates market still expected Federal Reserve easing in 2026, which flattered every asset that pays no income. Gold at $5,595 was not pricing one risk; it was pricing all of them simultaneously, with momentum funds and retail flows arriving last, as they usually do.
What followed is a case study in how safe-haven pricing decays. The oil shock that took Brent above $107 in April should, on the old logic, have been rocket fuel for gold. Instead the metal struggled, because the same shock fed inflation, and inflation pushed the Federal Reserve towards the hawkish repricing that culminated in markets pricing hikes rather than cuts. For a zero-yield asset, the discount rate matters more than the disaster. Gold discovered that its two sponsors, fear and easy money, had come into direct conflict, and the money argument won.
The structure of the buying explains the speed of the fall. Official-sector demand is steady, but the final leg from $4,500 to $5,595 was carried by faster money: momentum strategies, futures positioning and retail inflows that arrive because the price is rising and leave for the same reason. When the macro premise cracked, that layer exited at market, and prices that had climbed a staircase went down in an escalator. None of this is unusual; it is the standard anatomy of a blow-off top in any asset with a passive structural bid and an active speculative fringe. The lesson is not that the January buyers were wrong about the world, but that they paid a price which required everything to stay wrong at once.
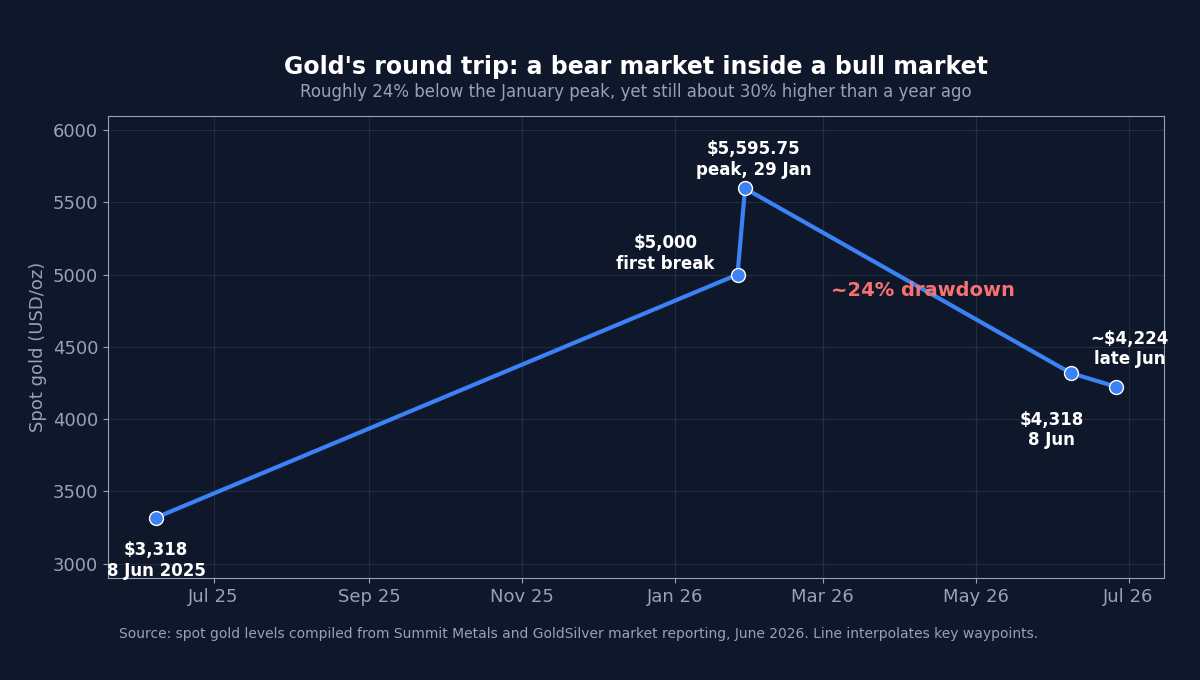
| Date | Spot gold | Versus January peak | Context |
|---|---|---|---|
| 8 June 2025 | $3,318 | – | Base of the final leg higher |
| 26 January 2026 | $5,000+ | -11% | First break of $5,000 |
| 29 January 2026 | $5,595.75 | Peak | All-time high; up ~113% in two years |
| 8 June 2026 | $4,318 | -22.8% | Leg lower after strong May payrolls |
| Late June 2026 | ~$4,224 | ~-24.5% | Technical bear market; still ~30% up year on year |
The Two Unwinds: Peace and Higher Rates
The first unwind was geopolitical. The US-Iran peace framework that took hold in June did to gold what it did to oil: it drained the insurance premium out of the price. War premia are rented, not owned, and when shipping resumed through the Strait of Hormuz the entire complex of hedges built against escalation, long oil, long gold, long defence, began to unwind together.
The second unwind was monetary, and it matters more. Gold pays nothing, so its fair value is inversely tied to the real return available on assets that do pay. When markets expected the Fed to cut, holding gold cost little. The sequence of firm payrolls and sticky inflation prints that pushed the Fed to a hawkish stance transformed that arithmetic: the strong 5 June payrolls report alone triggered a sharp leg lower in gold as hike expectations firmed and the dollar rallied. With cash yielding more than 3.5% and the 10-year Treasury near 4.45%, every month of higher-for-longer is a month of paying carry to own metal. Safe-haven flows, notably, have favoured the dollar itself over bullion, an inversion of the January pattern.
It is worth noticing who has not sold. Central banks bought a net 244 tonnes in the first quarter, per the World Gold Council, continuing the reserve-diversification programme that predates the 2024-2026 price surge. The official sector buys for reasons, sanctions insurance, dollar concentration, that do not change with the Fed’s dot plot. That bid did not prevent a 24% drawdown, which tells you it was never the marginal price-setter the bulls claimed; but it remains the floor under the structural story.
The Dollar Side of the Trade
There is an irony buried in the 2026 configuration that deserves a paragraph of its own. The single most cited structural argument for gold is reserve diversification away from the dollar; the single biggest cyclical force pushing gold down is the strength of that same dollar. Both are true at once because they operate on different clocks. Central banks accumulate metal over years to reduce concentration risk in their reserves, indifferent to the quarter’s price action. Traders, meanwhile, respond to the fact that the dollar currently pays its holder handsomely while gold charges rent. When the fear bid faded this spring, the dollar simply outcompeted bullion as the haven of convenience: deeper, yielding, and appreciating.
That competition will not resolve in gold’s favour until the yield argument weakens. But the diversification argument quietly strengthens the longer the dollar dominates, because every episode of dollar-dependence, from sanctions to funding squeezes, adds a reason for reserve managers to keep buying. The two forces are not contradictory; they are sequential. The dollar wins the trade today, and each year it does, the official sector’s motive to hold something outside the dollar system compounds.
Correction or Reversal? The Base Rates
Large drawdowns inside secular gold advances are historically normal. The 1970s bull market included a collapse of roughly 45% between 1974 and 1976 before the final run to the 1980 top. The 2001-2011 advance absorbed a 30% air pocket in 2008. In both cases the structural drivers, negative real rates then, reserve diversification now, survived the washout of the speculative layer. The 2026 decline has so far cleared out momentum and retail positioning that arrived in the final weeks of the melt-up, while leaving the official-sector accumulation intact.
The bearish counter-argument is that the current macro regime is genuinely hostile in a way the last decade was not. If the Federal Reserve delivers the hike markets now price, and real yields rise further, gold faces a persistent headwind that no quantity of central bank buying has historically offset. Gold fell for two decades after 1980 in exactly that configuration: positive and rising real rates, a credible inflation-fighting central bank, and a strong dollar. The honest framing is that gold’s next major move is a monetary policy call, not a geopolitical one.
| Scenario | Policy path | Gold implication | Key signal |
|---|---|---|---|
| Hawkish delivered | Fed hikes in 2026; real yields rise | Extended drawdown; 1980s-style headwind | 2-year yields and dollar strength |
| Hawkish unwound | Data softens; hike pricing fades | Sharp recovery; carry cost falls | Payrolls and CPI surprises |
| Shock returns | Geopolitical or financial stress event | Insurance bid returns violently | Oil, credit spreads, the yen |
Investor Implications
Cross-asset. Gold’s 24% drawdown is the cleanest single illustration of 2026’s regime: the market has traded insurance for carry. The same forces show up as the yen at multi-decade lows, compressed volatility in equities and the unwinding of the oil premium. Portfolios that held gold as a hedge have already experienced the cost of hedges in a regime where the feared events resolve peacefully and rates stay high; that is the price of insurance, not evidence it was wrong to own.
Commodities and metals exposure. The washout has been concentrated in the speculative layer: futures positioning and momentum flows that chased the January top. Physical and official demand remain structurally intact, which historically has set the conditions for a durable base once the rate shock is fully priced. The discipline is sequencing: the drawdown ends when the hike debate resolves, and buying before that resolution is a rates view expressed through metal.
Equities and fixed income read-across. Gold’s fall confirms what Treasuries and the dollar already say: markets believe the Fed’s hawkish turn. If gold begins rallying alongside a firm dollar and stable yields, that combination has historically been an early warning that stress is building somewhere in the system, the kind of signal that precedes rather than follows headlines. Gold spent the first half of 2026 as a risk asset; its next role change is worth watching for.
What to Watch
- Mid-July: the June US CPI print. A soft reading would undercut the hike pricing that has been gold’s principal headwind; a firm one extends it.
- 28-29 July: the FOMC meeting. Confirmation or retreat on the 2026 hike path is the single most important variable for the metal’s second half.
- Late July: the World Gold Council’s Q2 demand report, which will show whether official-sector buying held its 244-tonne first-quarter pace through the price decline.
- The dollar: safe-haven flows have favoured the dollar over bullion since spring. A reversal of that preference, particularly alongside stable yields, would be the first sign the bottom is forming.
Conclusion
Gold’s 2026 has been a study in how quickly a market can change its mind about what matters. In January the metal was priced for a dangerous world and a generous Fed; by June the world had become less dangerous and the Fed less generous, and a quarter of the price evaporated with barely a headline. What remains is the structural story that predated the mania: central banks steadily converting reserves into metal for reasons that have nothing to do with momentum. The 24% drawdown has returned gold to being what it was before the crowd arrived, a slow official-sector accumulation story wrapped around a fast monetary policy trade. Investors should be clear which of those two they own, because for the rest of 2026 they will not move together: the first is patient and largely price-insensitive, while the second will be decided in Washington, one data print at a time.
Frequently Asked Questions
Why is gold falling in 2026?
Two supports of the January peak have been removed. The US-Iran peace framework drained the geopolitical insurance premium, and the Federal Reserve’s shift from expected cuts to possible hikes raised the opportunity cost of holding a zero-yield asset. A firmer dollar has added further pressure, with safe-haven flows favouring the dollar over bullion.
Is gold in a bear market?
Technically yes. From the all-time high of $5,595.75 on 29 January 2026, spot gold has fallen roughly 24% to the low $4,200s, beyond the 20% threshold that defines a bear market. Context matters, though: gold remains about 30% higher than a year earlier, so the decline is so far a correction within a longer advance.
Are central banks still buying gold?
Yes. The World Gold Council reported net central bank purchases of 244 tonnes in the first quarter of 2026, continuing the reserve-diversification trend of recent years. Official-sector buying is driven by long-term considerations such as sanctions risk and dollar concentration, and it has persisted through the price decline.
What would turn the gold price around?
The most powerful catalyst would be an unwinding of Federal Reserve hike expectations, which would lower real yields and the cost of holding gold. A renewed geopolitical or financial stress event would also restore the insurance bid. Signals to monitor include US inflation prints, the July FOMC meeting and whether safe-haven flows rotate back from the dollar to bullion.
Sources: World Gold Council, Gold Demand Trends; Summit Metals, Gold Price Spot 2026 Guide; GoldSilver, Gold Price Outlook June 2026; Capital.com, Gold Price Forecast: US Payrolls Lift Rate Bets; Investing.com, Gold Holds Range as Safe-Haven Flows Favor the US Dollar.
Related Reading: The peace framework that drained gold’s war premium is covered in The US Iran Peace Deal and the Unwinding of the 2026 Risk Premium, and the monetary shift that raised the cost of holding metal is analysed in From Cuts to Hikes: The Fed Rate Hike Repricing. For the same deleveraging seen in another non-yielding asset, see The June 2026 Crypto Deleveraging. For the fundamentals, start with our explainer on safe havens and the dollar’s reserve currency role. Gold’s non-response to July’s Strait of Hormuz attacks confirmed how completely the rate trade now dominates the fear trade. The July escalation and the hedge’s continued failure are covered in the Strait of Hormuz toll that lasted a day. The UK leg of the rate trade is analysed in UK Gilt Yields Above 5%.

Leave a Reply