
Khan Capitals | July 2026
Key Takeaways
- BlackRock’s assets under management reached a record $15.3 trillion in the second quarter, up from $13.89 trillion three months earlier, with adjusted earnings of $13.91 per share beating consensus by roughly 11 per cent and the shares jumping 6.6 per cent on the day.
- Nearly nine tenths of the AUM jump was the market, not new money. Of the roughly $1.45 trillion added in the quarter, about $1.28 trillion came from rising asset prices and $192 billion from net client inflows, a decomposition that matters far more than the headline.
- The organic engine is still running hard. First-half net inflows hit a record $321 billion, twelve-month inflows total $868 billion, and organic base fee growth is running at 10 per cent, at the top of the firm’s long-stated ambition.
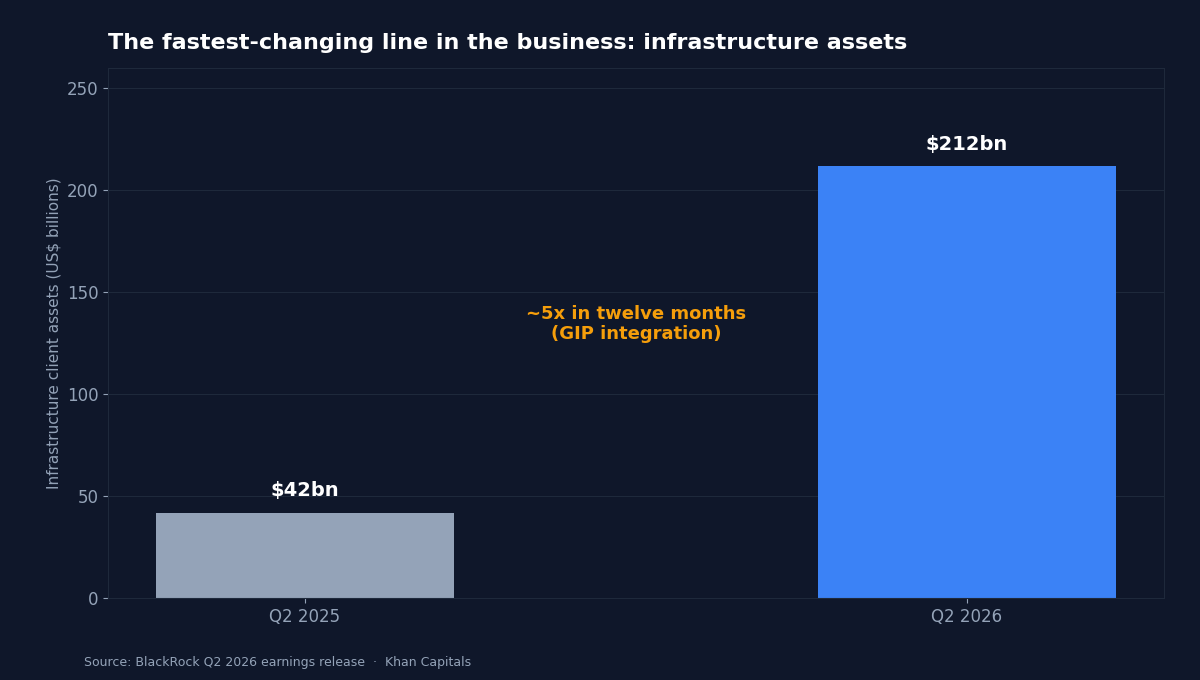
- The quarter showed the new BlackRock taking shape. HPS contributed roughly $230 million of base fees, infrastructure client assets have quintupled to $212 billion since the GIP acquisition, and technology services contract value grew 15 per cent as Aladdin, eFront and Preqin sell as one platform.
- Margins tell the operating leverage story: revenue rose 31 per cent year on year to $7.08 billion while the adjusted operating margin expanded 260 basis points to 45.9 per cent, the best in almost five years.
Part of: Private Credit & Private Markets – Khan Capital’s hub on private credit and private markets.
The Largest Pool of Money Ever Assembled
On 15 July, in the middle of the sharpest technology selloff of the year, the world’s largest asset manager reported the largest quarter in its history. BlackRock’s record AUM of $15.3 trillion is a number that resists comprehension: larger than the annual output of every economy on earth except the United States and China, and more than a trillion dollars higher than it was at the start of the year. The market’s reaction was unambiguous. The shares rose 6.6 per cent, their best earnings-day move in years, while the rest of the tape struggled.
The headline numbers were emphatic. Revenue of $7.08 billion was up 31 per cent year on year. Adjusted earnings per share of $13.91 beat expectations by roughly 11 per cent. The adjusted operating margin reached 45.9 per cent, 260 basis points higher than a year ago and the firm’s best in nearly five years. In a week dominated by record bank earnings, BlackRock still managed to stand out.
| Metric | Q2 2026 | Context |
|---|---|---|
| Assets under management | $15.34 trillion | Record; $13.89 trillion at end-Q1 |
| Quarterly net inflows | $192 billion | Record H1 total of $321 billion |
| Revenue | $7.08 billion | +31% year on year |
| Adjusted EPS | $13.91 | Beat consensus by ~11% |
| Adjusted operating margin | 45.9% | +260bps; best in ~5 years |
| Organic base fee growth | 10% | Top of the firm’s target range |
A Record Built Mostly of Beta
The most important line in the release is the one the headlines skipped. Of the roughly $1.45 trillion BlackRock’s AUM grew during the quarter, approximately $1.28 trillion, or close to nine tenths, came from rising markets. Net new client money contributed $192 billion. That is a very good flow quarter by any standard, but it means the record was made mostly by the assets BlackRock already held going up in price, not by new business.
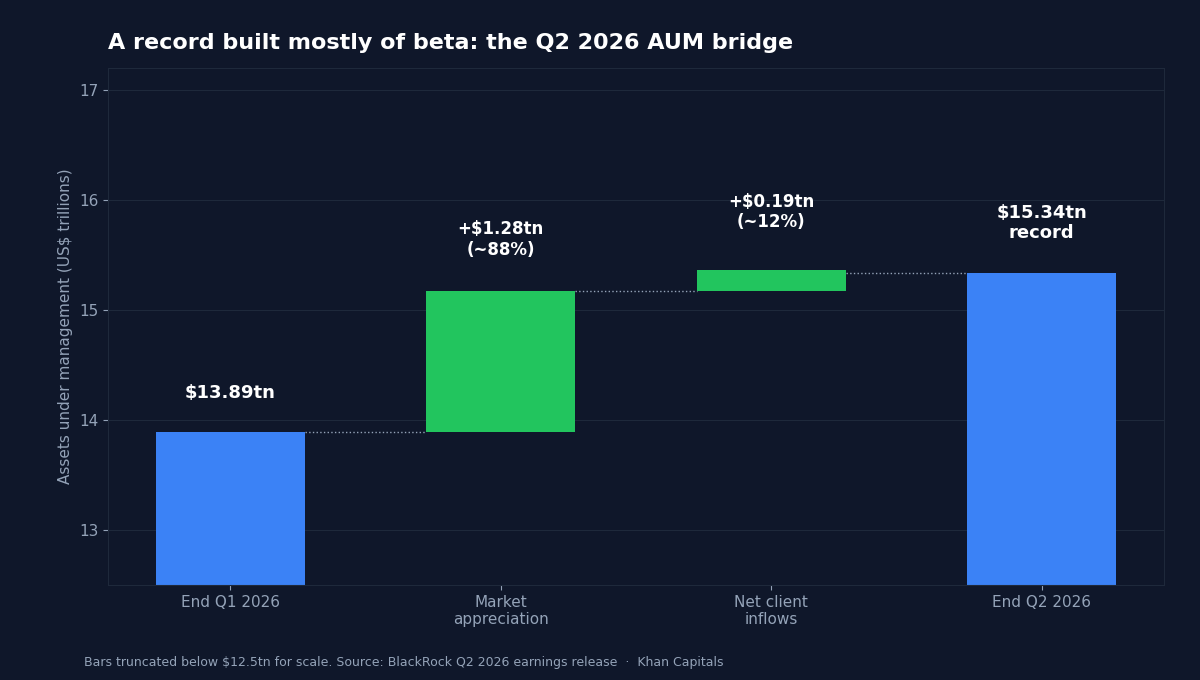
This is not a criticism; it is the business model. An index-fund giant is, mechanically, a levered claim on the level of world markets. When the S&P 500 closes a record first half, as it just did, BlackRock’s revenue base expands without the firm lifting a finger, and the operating margin does exactly what this quarter’s did. The uncomfortable corollary runs the other way: the same arithmetic that manufactured this record would work in reverse in a sustained drawdown, and the week’s semiconductor bear market was a reminder of how quickly the tape can turn on the most crowded exposures.
For investors in the asset management sector, the decomposition is the analysis. Fee revenue tied to market levels is high-quality income in a bull market and pure cyclicality in a bear one. The reason BlackRock’s management has spent two years and tens of billions of dollars buying its way into private markets and data is precisely that it understands this better than anyone.
The Flows Underneath the Froth
Strip out the market effect and the underlying franchise still had an exceptional quarter. The $192 billion of net inflows brought the first half to a record $321 billion, with flows over the trailing twelve months of $868 billion. Organic base fee growth of 10 per cent sits at the very top of the range management has promised investors for years and routinely missed in tougher tapes. The inflows were also broad: ETFs led as always, but private markets, active fixed income and systematic equity strategies all contributed.
Breadth matters because it addresses the oldest objection to the asset-gathering model: that flows are just beta-chasing by retail investors who arrive at the top. Flows into active fixed income during a rate-hike scare, and into private markets during a redemption-gate cycle we have covered at length, are not momentum money. They are allocation decisions, and they are stickier than the index flows that dominate the headlines.
The Down Payment on a Different Company
The quarter also offered the clearest evidence yet that the acquisitions of the past two years are becoming a second engine. HPS, the private credit manager BlackRock bought to force its way into direct lending, contributed roughly $230 million of base fees in its first full quarters inside the firm, helping push base fee and securities lending revenue to $5.7 billion, up 29 per cent year on year. Infrastructure client assets have grown from $42 billion to $212 billion in a year, a five-fold increase driven by the integration of Global Infrastructure Partners.
The technology story is quieter but arguably more strategic. Technology services and subscription revenue grew again, and annual contract value rose 15 per cent year on year, as Aladdin, eFront and Preqin are increasingly sold as a single stack covering public markets, private markets and the data layer between them. A firm that charges basis points on $15 trillion is a cyclical business; a firm that also charges subscriptions for the operating system of the investment industry is less of one. That is the trade management is making, and this quarter was the first in which both halves visibly pulled in the same direction.
| Growth driver | Contribution in Q2 | Character of the revenue |
|---|---|---|
| Market appreciation | ~$1.28 trillion of AUM (~88% of the rise) | Cyclical; reverses in drawdowns |
| Net client inflows | $192 billion of AUM | Organic; broad across ETFs, active, private |
| HPS (private credit) | ~$230 million of base fees | Locked-up capital; durable fees |
| GIP (infrastructure) | Client assets $42bn to $212bn in a year | Long-dated; fee streams span decades |
| Technology (Aladdin, eFront, Preqin) | ACV +15% year on year | Subscription; least market-sensitive |
BlackRock’s Record AUM at the Top of the Cycle
There is a reason records like this deserve a moment of unease alongside the applause. Asset managers post their best numbers when markets are at their highest, which is by definition when forward returns are most in doubt. BlackRock reported this quarter into a tape where the chip complex had just entered a bear market, oil was back above $80, and the rate market was pricing a September hike. The firm’s own results are, in that sense, a snapshot of the very top of the pool it swims in.
History offers both comfort and caution. The comfort: diversified asset gatherers have repeatedly proven more resilient than their beta suggests, because bear markets accelerate the consolidation of assets towards the largest, cheapest platforms. The caution: fee rates ratchet down in every cycle, and the index-fund price war never truly ends. The 2022 drawdown took BlackRock’s AUM down by roughly $1.7 trillion in a year, and the shares fell far more than the market. A $15.3 trillion asset base changes the scale of that exposure, not its direction. What has changed since 2022 is the composition: every quarter of HPS fees, GIP distributions and Aladdin subscriptions shifts a little more of the revenue line out of the market’s reach, and that shift, not the AUM headline, is what a long-term owner of the shares is actually underwriting.
The One Business That Shrank
Amid the records, one line moved the other way. BlackRock’s digital asset franchise, anchored by the IBIT bitcoin fund that became the fastest-growing ETF in history after its 2024 launch, has seen assets shrink by roughly a fifth as bitcoin retreated from its highs and traded in the mid $60,000s. The decline is a rounding error against $15.3 trillion, but it is instructive for two reasons.
First, it demonstrates the same beta arithmetic in miniature. Crypto ETF assets are a pure function of coin prices and flows, and when the underlying falls, the business shrinks with it, whatever the distribution muscle behind it. Second, it is a useful check on the narrative that product innovation alone drives asset growth. IBIT gathered assets faster than any product in the industry’s history when its underlying was rising; it is shedding them now that the underlying is not. Distribution amplifies markets. It does not replace them.
The contrast with the private markets build-out is the point. Locked-up infrastructure and credit vehicles cannot be redeemed on a bad quarter’s sentiment, which is exactly why management is willing to pay premium multiples to own them. In a firm whose fortunes float on daily-priced markets, the scarcest asset is revenue that cannot leave.
The Chart to Watch
BlackRock’s shares have behaved this year like what the firm increasingly is: a diversified financial with an embedded market call. The earnings-day gap is the market paying up for the private markets and technology story; whether the gap holds through a rougher tape is the cleaner test of how much of the re-rating is structural.
Investor Implications
Equities. The quarter strengthens the case that scale in asset management is now a winner-takes-most phenomenon: flows, margin and multiple are all consolidating towards the platforms that can bundle indexing, private assets and technology. For the traditional active managers below the top tier, every quarter like this one raises the bar. Within the sector, the differentiation question is simple to state and hard to answer: how much of a manager’s revenue survives a 20 per cent drawdown? BlackRock’s answer improved this quarter; most competitors’ did not.
Fixed income. BlackRock’s flow data doubles as a map of where bond allocations are going: into active fixed income at a 10 per cent organic clip, and into private credit through vehicles that lock capital up. That second flow is the structural one. Every dollar that migrates from daily-liquidity bond funds into locked-up private credit changes the liquidity profile of the credit market itself, a theme we explored when the largest private credit deal on record began trading.
Cross-asset. A $15.3 trillion balance of other people’s money is itself a market signal. Record allocations at record prices describe a market fully invested and confident, historically a late-cycle configuration rather than an early one. That is not a timing tool. It is a reminder that the same flows that build records are procyclical in both directions.
Conclusion
BlackRock’s record AUM quarter is two stories wearing one headline. The first is cyclical: markets at all-time highs did most of the work, and what beta gives, beta can take away. The second is structural, and it is the more interesting one: a firm that already won the indexing era is spending its winnings on the things indexing cannot commoditise, locked-up private capital and the technology layer of the investment industry, and this quarter both began paying visibly.
The $230 million of HPS fees and the quintupling of infrastructure assets are small numbers next to $15.3 trillion. But they are the numbers that decide what BlackRock is worth in the next bear market, which is when asset managers are truly priced. On this quarter’s evidence, the transformation is ahead of schedule, and the market’s willingness to pay a record price for it on a red tape day suggests investors have noticed.
Frequently Asked Questions
How much money does BlackRock manage in 2026?
BlackRock reported a record $15.3 trillion of assets under management at the end of the second quarter of 2026, up from $13.89 trillion three months earlier. The firm has added more than $1 trillion of assets since the start of the year, making it comfortably the largest asset manager in the world.
Did the record come from new client money?
Mostly not. Of the roughly $1.45 trillion added during the quarter, about $1.28 trillion came from rising market prices and $192 billion from net client inflows. The inflows were still strong, bringing the first half to a record $321 billion, but the record itself was primarily a function of markets at all-time highs.
Why did BlackRock shares rise 6.6 per cent on the results?
The beat was broad: earnings per share of $13.91 exceeded consensus by around 11 per cent, revenue grew 31 per cent, and the adjusted operating margin reached a near five-year high of 45.9 per cent. Investors also rewarded evidence that the HPS and GIP acquisitions are contributing meaningful fees, diversifying the firm away from pure market-linked revenue.
What happens to BlackRock’s revenue if markets fall?
Because most of BlackRock’s fees are charged as a percentage of assets, a sustained market decline shrinks revenue with a lag, as it did in 2022 when AUM fell by roughly $1.7 trillion. The firm’s growing private markets and technology subscription businesses are less market-sensitive, which is a central reason management has invested so heavily in them.
Sources: BlackRock Newsroom, BlackRock Q2 2026 Earnings Release (PDF), Morningstar, Investing.com, Private Banker International, Funds Society.
Related Reading: The banks’ side of the record week is covered in Wall Street’s record quarter, while the tape BlackRock reported into is analysed in the semiconductor bear market. The private credit build-out that HPS anchors runs through the $35 billion deal that started trading this month and the reopened IPO window. For the industry-wide picture behind those flows, see the Fed’s $1.3 trillion private credit survey. For the fundamentals, start with how ETFs and index funds actually work and what private credit is. For the sovereign-scale partnerships now driving asset gathering, see the $16 billion Kuwait pipeline deal.

Leave a Reply