Khan Capitals | July 2026
Key Takeaways
- Goldman Sachs had the best quarter in its history. Net revenues of $20.34 billion, up 39 per cent, diluted earnings per share of $20.98, up 92 per cent, and an annualised return on equity of 23.5 per cent, 10.7 percentage points higher than a year earlier.
- The whole group printed money. JPMorgan made $21.2 billion, its largest quarterly profit ever. Citi delivered its best revenue in a decade. Bank of America’s profit rose 27 per cent. Investment banking fees across the big five reached roughly $11.1 billion, the highest since 2021.
- The market did not treat the records as equal. Goldman rose sharply. Citi beat consensus by about 16 per cent on record equities trading and its shares reversed lower. The discrimination was about earnings quality, not size.
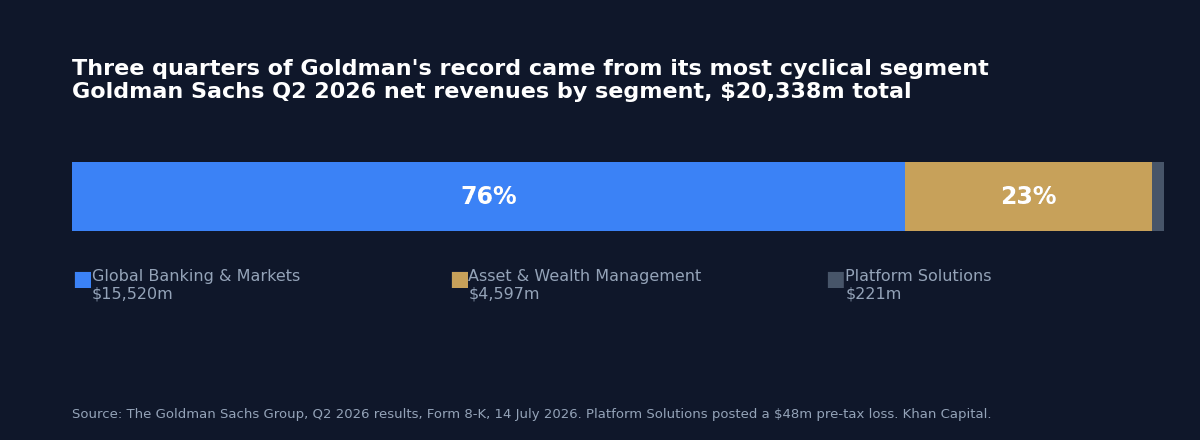
- Much of it does not recur by construction. JPMorgan’s record included a $4.6 billion gain on its Visa stake. SpaceX’s listing paid 23 banks around $500 million in fees. Goldman drew 76 per cent of its net revenues from its most cyclical segment.
- The sell side was bearish going in. Oppenheimer cut Goldman and Morgan Stanley to Underperform in late June on valuation, days before the best quarter Goldman has ever reported.
Wall Street’s Record Quarter, and the Day That Framed It
Wall Street’s record quarter arrived on 14 July, when the five largest American banks reported within a few hours of each other. Between them they hold more than $13 trillion of assets, and the results were, on any reading of the headline numbers, extraordinary. Goldman Sachs produced the best quarter in the firm’s history. JPMorgan produced the largest quarterly profit any American bank has ever made. Citigroup produced its best revenue in ten years. Bank of America grew profit 27 per cent. Wells Fargo earned $6.4 billion.
The same session saw IBM lose a quarter of its value on a 3.7 per cent revenue miss, the worst day in its listed history. Goldman’s strength is what kept the Dow from closing red. Two American institutions, one 115 years old and one 157, moving violently in opposite directions on the same afternoon, on numbers that were in both cases about the composition of revenue rather than its size.
That is the thread worth pulling. The interesting fact about 14 July is not that the banks made a lot of money. It is that the market, presented with five records, declined to pay for all of them.
What Goldman Actually Did
The Goldman figures deserve to be stated in full, because they are genuinely remarkable and because the caveats only mean something against them. Net revenues of $20,338 million, up 39 per cent on the second quarter of 2025. Net earnings of $6,628 million. Net earnings applicable to common shareholders of $6,399 million, up 84 per cent. Diluted earnings per share of $20.98, up 92 per cent. Annualised return on equity of 23.5 per cent and return on tangible equity of 25.5 per cent. An efficiency ratio of 57.4 per cent.
Global Banking and Markets, the trading and advisory engine, delivered record net revenues of $15,520 million, up 53 per cent, on record Equities revenues, significantly higher FICC, and investment banking fees 55 per cent higher year on year at a record $3.40 billion. Asset and Wealth Management contributed $4,597 million, helped by record management fees and higher gains on private equity holdings. Assets under supervision reached a record $4.04 trillion, up $391 billion in a single quarter, with $91 billion of long-term net inflows and a record $59 billion of third-party alternatives fundraising.
The firm raised its quarterly dividend 11 per cent to $5.00 a share for the third quarter and returned $5.36 billion to shareholders in the quarter, including $4.00 billion of buybacks, while holding a standardised CET1 ratio of 12.9 per cent. There was one blemish, and it is a small one in context: Platform Solutions revenues fell 64 per cent to $221 million and the segment lost $48 million before tax, on markdowns to the Apple Card loan portfolio now held for sale. Goldman’s consumer experiment continues to be wound down quietly while the core business prints records.
| Bank | Q2 2026 headline | Investment banking fees | Return metric |
|---|---|---|---|
| Goldman Sachs | Net revenues $20.34bn (+39%); EPS $20.98 (+92%) | $3.40bn (+55%), a record | ROE 23.5%; ROTE 25.5% |
| JPMorgan Chase | Net income $21.2bn; EPS $7.70; managed revenue $58.0bn (+27%) | $3.3bn (+30%), highest since 2021 | NII $25.6bn (+10%) |
| Citigroup | Net income $5.8bn (+45%); EPS $3.15; revenue $24.8bn (+14%) | $1.55bn (+44%) | RoTCE 13% |
| Bank of America | Profit +27%; non-interest income $15.6bn (+22%) | +50% year on year | n/d |
| Wells Fargo | Net income $6.4bn; EPS $2.00 | $939m (+35%) | n/d |
The Market Read the Composition, Not the Headline
Citigroup is the instructive case. It beat consensus earnings by roughly 16 per cent. Revenue of $24.8 billion was its best in a decade, with more than nine points of positive operating leverage. Markets revenue crossed $7 billion, up 17 per cent, on record equities trading of $2.3 billion, up 45 per cent. Investment banking fees rose 44 per cent to $1.55 billion. Services delivered its highest ever quarterly revenue at a return above 30 per cent. The bank bought back $4 billion of stock and signalled a 12 per cent dividend increase.
The shares reversed lower.
Goldman, reporting the same morning into the same tape, rose sharply. The difference is not the size of the beat. It is what the beat was made of, and what it implies about the year after this one. Citi’s return on tangible common equity was 13 per cent. Goldman’s was 25.5 per cent. Both are records or near-records for the institution in question, and one of them is roughly twice the other. A market that is paying for durable returns on capital rather than for quarterly profit will treat those two numbers very differently, and on 14 July it did.
This is the same instinct, pointed in a different direction, that produced IBM’s collapse hours earlier. In both cases the market looked past the headline number to ask what the revenue was made of and whether it would be there next year. IBM could not answer because it withheld its guidance. Citi answered, and the answer was: record trading. Trading is the most cyclical revenue line in banking and has always commanded the lowest multiple, because it is a function of volatility and volume rather than of a contract. Goldman’s answer was: record trading, and also $4.04 trillion of assets under supervision, $91 billion of net inflows, and a record year for alternatives fundraising. One of those answers extends beyond the quarter.
Where the Money Came From
Three specific things happened in the second quarter, and all three have finite lives.
The first is the reopening of the listing window, which Khan Capital examined at the start of the month in the IPO window reopens. That piece was a forecast about fee income; this quarter is the profit and loss confirmation. SpaceX’s June listing alone paid 23 banks roughly $500 million in fees, with Goldman Sachs and Morgan Stanley taking about $100 million each, and helped drive equity capital markets fees to around $2.5 billion. A single deal of that size is not a run rate. It is the largest flotation ever executed, and there is not another one queued behind it.
The second is the mergers cycle. Large-cap corporate M&A volumes ran roughly 90 per cent higher in the first half of 2026 than in the same period of 2025. That is a genuine cyclical upswing and it has a tail, because announced deals pay fees on completion over the following quarters. It is also, historically, the most reliably mean-reverting series in the industry.
The third is volatility. Equities trading revenue at JPMorgan rose 86 per cent year on year to $6.0 billion. At Citi it rose 45 per cent to a record $2.3 billion. Trading desks make money when clients need to move risk, and the first half of 2026 gave clients a great deal of risk to move: an oil shock, a war, a Fed that switched from cutting to hiking, a semiconductor complex swinging violently in both directions. Every one of those is an input the banks do not control and cannot forecast.
And then there is JPMorgan’s $4.6 billion gain on its Visa stake, which is not a business at all. It is an asset revaluation that happened to land in the quarter. A record profit that includes it is a record profit; it is simply not a record that tells you anything about next year.
The Fee Engine Restarted
Set the caveats aside for a moment, because the underlying shift is real and it is the most important thing in these results. Investment banking fees across JPMorgan, Goldman, Morgan Stanley, Bank of America and Citigroup came in around $11.1 billion, up roughly 27 per cent year on year and the highest since 2021. Every one of the five grew fees at a double-digit rate, and three of them grew at more than 40 per cent.
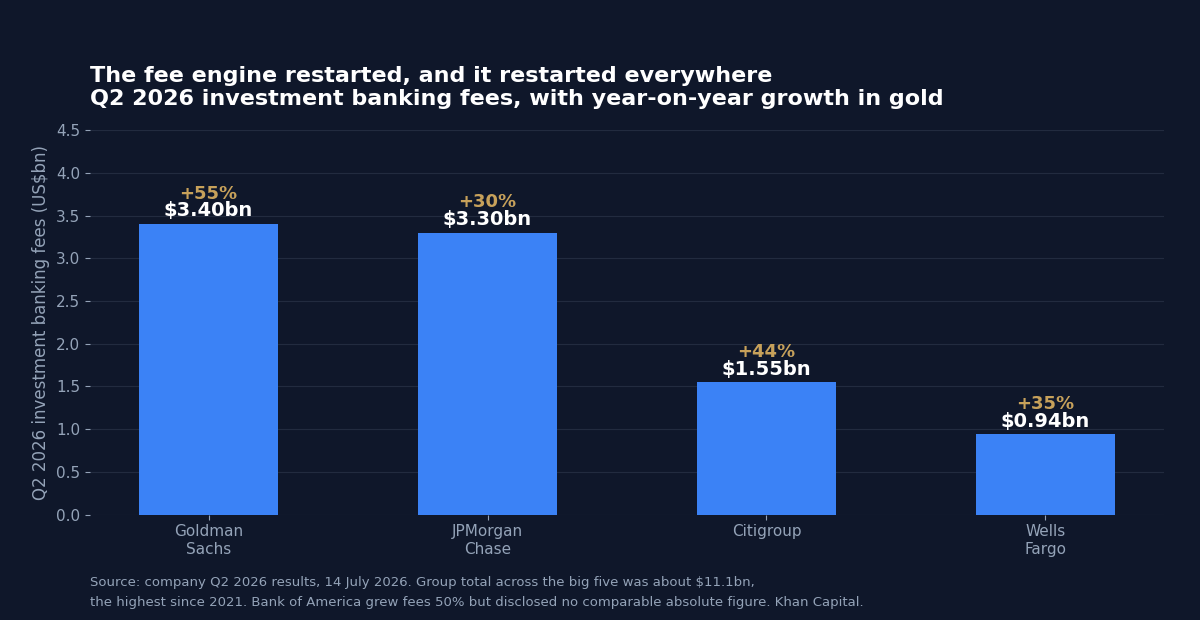
That matters because investment banking fees were the industry’s dead limb for three years. From 2022 through most of 2025 the listing window was shut, sponsors could not exit, and the advisory business shrank while the banks lived off net interest income earned on higher rates. The machine that has just restarted is the one that had been written off, and it restarted at the precise moment the rate cycle turned against net interest income. That rotation, from balance sheet to fees, is what a healthy investment bank is supposed to do, and it is why Goldman’s mix looks better than a pure lender’s.
The question is what a restarted fee engine is worth. Fee and advisory revenue is not contracted. It is a call option on corporate confidence, and corporate confidence in July 2026 is being underwritten by an equity market at records and a credit market that is financing anything with an artificial intelligence label on it. If either of those changes, the pipeline that produces next year’s fees stops converting, and it stops converting quickly.
The Downgrades That Preceded the Records
There is a detail here that ought to make anyone cautious about drawing confident conclusions from a single quarter. At the very end of June, days before the best quarter Goldman Sachs has ever reported, Oppenheimer downgraded Goldman and Morgan Stanley from Perform to Underperform, and cut Citigroup and Bank of America from Outperform to Perform. The argument was valuation: the sector was priced for perfection.
The results made that call look poorly timed within a fortnight. But the reasoning and the outcome are separable, and this is the part worth sitting with. A view that bank shares had already discounted a strong quarter is not refuted by a strong quarter. It is tested by what happens to the shares when the quarter arrives, and what happened is that Citigroup beat by 16 per cent and fell. On that specific name, the “priced for perfection” thesis was not wrong. It was early by two weeks and right on the tape.
The broader lesson is the one Khan Capital has now watched play out three times this month, at Samsung, at IBM, and now across the banks: in the summer of 2026 the market has stopped paying for good numbers and started paying for good numbers it believes will repeat. Beats are not being rewarded. Durability is.
| Scenario for the fee cycle into 2027 | What would have to hold | Implication for the group |
|---|---|---|
| Bull: a genuine cycle | The listing pipeline refills behind SpaceX; M&A volumes hold near first-half levels; credit stays open to AI-linked borrowers; volatility stays elevated enough to feed trading | Fee revenue is re-rated as a mid-cycle run rate rather than a spike. The banks with fee and asset franchises, rather than balance sheets, carry the premium. |
| Base: a strong year, then normalisation | Announced M&A converts into completion fees through 2026; the IPO window stays open but without another SpaceX; trading normalises as the rate path settles | Second-half comparisons stay favourable and 2027 gets harder. Trading-led beats keep getting sold; asset-gathering keeps getting paid. |
| Bear: the option expires | Equity markets stall, credit tightens around the AI build-out, corporate confidence cracks and the pipeline stops converting | Fee revenue falls faster than costs. The 2026 records become the peak comparison every subsequent quarter is measured against. |
What the Records Say About the Cycle
Two facts from this quarter sit awkwardly together, and holding both is the honest position.
The first is that the banks are in demonstrably better shape than at any point since the financial crisis. Goldman earned a 23.5 per cent return on equity with a 12.9 per cent CET1 ratio, which is to say it produced those returns while carrying capital that would have been unimaginable in 2007. Every one of the thirty-two banks in this year’s stress test passed, as Khan Capital covered when the 2026 payout cycle began. Citi is running above 30 per cent returns in Services. Capital is being returned rather than hoarded. This is not a fragile system making money on leverage.
The second is that the earnings mix is at its most cyclical in years, at valuations that already discount a lot. Goldman drew 76 per cent of its net revenues from Global Banking and Markets. JPMorgan’s record leans on an 86 per cent jump in equities trading and a $4.6 billion one-off. Roughly $500 million of industry fee income came from a single flotation that will not be repeated. None of that is a criticism of the banks, which are doing exactly what they exist to do when conditions are this favourable. It is an observation about what an investor is buying when they buy the quarter.
The reconciliation is that this is a very good cyclical peak in a structurally sounder industry. Both halves of that sentence are load-bearing, and the market spent 14 July trying to price which half matters more, arriving at different answers for different banks.
Investor Implications
Equities. The dispersion within the group is now more informative than the group. Goldman and Citi reported records on the same morning and their shares went in opposite directions, which tells you the sector is no longer trading as a single rates-and-credit proxy. The variable being priced is the durability of the revenue mix: fee and asset-gathering franchises against balance-sheet and trading franchises. Anyone extrapolating the second quarter across the sector is implicitly forecasting that M&A volumes, the listing window and volatility all persist together, which is three bets, not one.
Fixed income. For bank credit, this quarter is unambiguously good. Record earnings, CET1 ratios near 13 per cent, and a stress test that absorbed a $708 billion hypothetical loss with a 1.6 point capital dent describe a sector with a wide equity cushion in front of bondholders. The nuance is that the same fee boom is being generated by underwriting an artificial intelligence build-out whose financing is increasingly concentrated, a concentration visible in the $35 billion private credit financing that began trading this month. Bank credit is not exposed to that directly. Bank fee income is.
Cross-asset. The most useful reading of 14 July is as a single, unusually clean natural experiment. The market was handed one large miss with no guidance and five records of differing quality, in one session, and it priced them consistently: it punished the absence of information hardest, it paid for recurring revenue, and it declined to pay full price for anything cyclical, however large. That is a market at records behaving with considerably more discrimination than a market at records is usually credited with.
What to Watch
- Mid-October: third-quarter results, the first clean read on whether fee income holds without a SpaceX-scale flotation in the comparison.
- Through the second half: the conversion rate of announced M&A into completion fees. Volumes ran roughly 90 per cent higher in the first half; fees are paid on closing, not announcement.
- The listing pipeline: whether anything of consequence files behind SpaceX. An open window with nothing to put through it produces no fees.
- JPMorgan’s net interest income guide: management now expects roughly $105.5 billion for 2026. A rate path that turns hawkish again, as the September debate suggests it might, changes both the NII line and the fee line, in opposite directions.
- Volatility: trading revenue of the kind reported this quarter requires clients moving risk. A calmer second half is good for most assets and bad for this specific line.
Conclusion
Wall Street’s record quarter was real. Goldman Sachs has never done better in its history, JPMorgan has never made more money, and the fee engine that was declared structurally impaired three years ago has restarted at $11.1 billion a quarter. The banks are earning crisis-era returns on post-crisis capital, which is an achievement worth naming plainly.
But the market did not buy the records; it bought some of them. It paid Goldman for $4.04 trillion of assets under supervision and sold Citigroup a 16 per cent beat built on trading. On the same day it destroyed a 115-year-old technology company for missing revenue by 3.7 per cent and declining to say what came next. Those three reactions look inconsistent only until you notice they are the same reaction: a market pricing the durability of a revenue line rather than the size of a print.
The second quarter of 2026 will be the comparison every subsequent quarter is measured against. That is what makes a peak useful, and what makes it a peak.
Frequently Asked Questions
How much did Goldman Sachs make in Q2 2026?
Goldman Sachs reported net revenues of $20.34 billion, up 39 per cent year on year, and net earnings of $6.63 billion, for diluted earnings per share of $20.98. That was up 92 per cent on the second quarter of 2025 and the best quarter in the firm’s history. Annualised return on equity was 23.5 per cent and return on tangible equity 25.5 per cent.
Why did Citigroup shares fall despite beating expectations?
Citi beat consensus by roughly 16 per cent and delivered its best revenue in a decade, but the beat was led by record equities trading, up 45 per cent to $2.3 billion. Trading is the most cyclical revenue line in banking and historically attracts the lowest valuation multiple, because it depends on volatility and client flow rather than contracted income. Citi’s return on tangible common equity of 13 per cent was also roughly half Goldman’s, which reported the same morning and rose.
Are bank earnings at a cycle peak?
Several of the quarter’s largest contributors do not repeat by construction: JPMorgan’s result included a $4.6 billion gain on its Visa stake, SpaceX’s listing paid 23 banks around $500 million in fees, and first-half M&A volumes ran roughly 90 per cent above the prior year. Whether this proves to be a peak depends on the listing pipeline refilling, M&A volumes holding and volatility persisting, which are three separate conditions rather than one. The capital position underneath, with CET1 ratios near 13 per cent, is considerably stronger than at previous peaks.
Sources: The Goldman Sachs Group, second-quarter 2026 results, Form 8-K, 14 July 2026; Goldman Sachs Investor Relations; Wells Fargo & Company, second-quarter 2026 earnings release, Form 8-K Exhibit 99.1 (SEC); “JPMorgan Chase Q2 2026 earnings: record profit on trading surge”, 14 July 2026; Citigroup second-quarter 2026 results coverage, 14 July 2026; Disruption Banking, “Goldman Sachs Posts Record $3.4bn Investment-Banking Quarter”, 14 July 2026; The Motley Fool, “A Downgrade Wave Says Bank Stocks Are Priced for Perfection”, 9 July 2026.
Related Reading: this quarter is the profit and loss confirmation of the forecast in the IPO window reopens, whose central exhibit, the SpaceX flotation, is traced back to the $1.75 trillion filing that started it. For the capital position underwriting these payouts see the 2026 Fed stress test, for the market backdrop see the best quarter since 2020, and for the same session’s mirror image see IBM’s worst day on record. For the fundamentals, start with how beats and misses actually work and how companies return cash to shareholders. The other side of that rotation is charted in The Semiconductor Bear Market. The asset management side of the record week is covered in BlackRock’s $15.3 trillion quarter.

Leave a Reply