
Khan Capitals | July 2026
Key Takeaways
- The chip complex is officially in a bear market. The Philadelphia Semiconductor Index closed 17 July more than 20 per cent below its late-June record, ending a rally of roughly 105 per cent from the March low in barely three weeks of selling.
- The declines are broad, not concentrated. The VanEck Semiconductor ETF fell almost 9 per cent this week, its third weekly decline in four, and is down more than 17 per cent in July alone; Marvell, Arm and Intel have each lost more than 30 per cent from their peaks.
- Prices are falling against record fundamentals. The drawdown has run straight through TSMC’s record quarter, the largest first-time US listing ever by a foreign company, and Samsung’s record guidance, a divergence between results and returns that defines this episode.
- The money is moving, not vanishing. Investors pulled $7.18 billion from growth funds in a week while value funds took in $3 billion, and $824 million left a single leveraged Nvidia ETF, a rotation out of amplified exposure rather than a wholesale exit from equities.
- This is a repricing of the multiple, not the order book. With Brent back above $80 and markets pricing a September rate hike, the discount rate applied to trillions of dollars of projected AI capital spending has risen, and the market has stopped paying for perfect execution.
Part of: The AI Infrastructure Supercycle – Khan Capital’s hub on the AI infrastructure build-out.
Twenty Per Cent in Three Weeks
Bear markets usually take months to build. This one took fifteen trading sessions. On 17 July the Philadelphia Semiconductor Index, the thirty-stock benchmark that has carried the market’s artificial intelligence story for three years, closed more than 20 per cent below the record it set in late June. That is the conventional threshold for a semiconductor bear market, and it arrived while the index’s constituent companies were reporting some of the strongest results in their histories.
The speed is the story. The index had climbed roughly 105 per cent between its March low and the June peak, one of the steepest sector advances on record. The unwind began on 2 July with a 6.7 per cent single-day fall, the benchmark’s worst session since the post-pandemic normalisation selloff, and it has barely paused since. July alone has erased roughly a third of the sector’s 2026 advance. The VanEck Semiconductor ETF, the most traded vehicle for the sector, fell almost 9 per cent this week, its third weekly decline in four, and is down more than 17 per cent this month.
Nor is the damage confined to one or two names. Nvidia, the anchor of the entire trade, has held up comparatively well and still trades just below the $200 mark, down about 17 per cent from its May record. The periphery has fared far worse. Intel lost 21 per cent in seven trading days. Micron is down 17 per cent from its $1,213 peak. Marvell and Arm have each surrendered more than 30 per cent from their highs. The pattern, a resilient core and a collapsing periphery, is what crowded trades look like when they unwind.
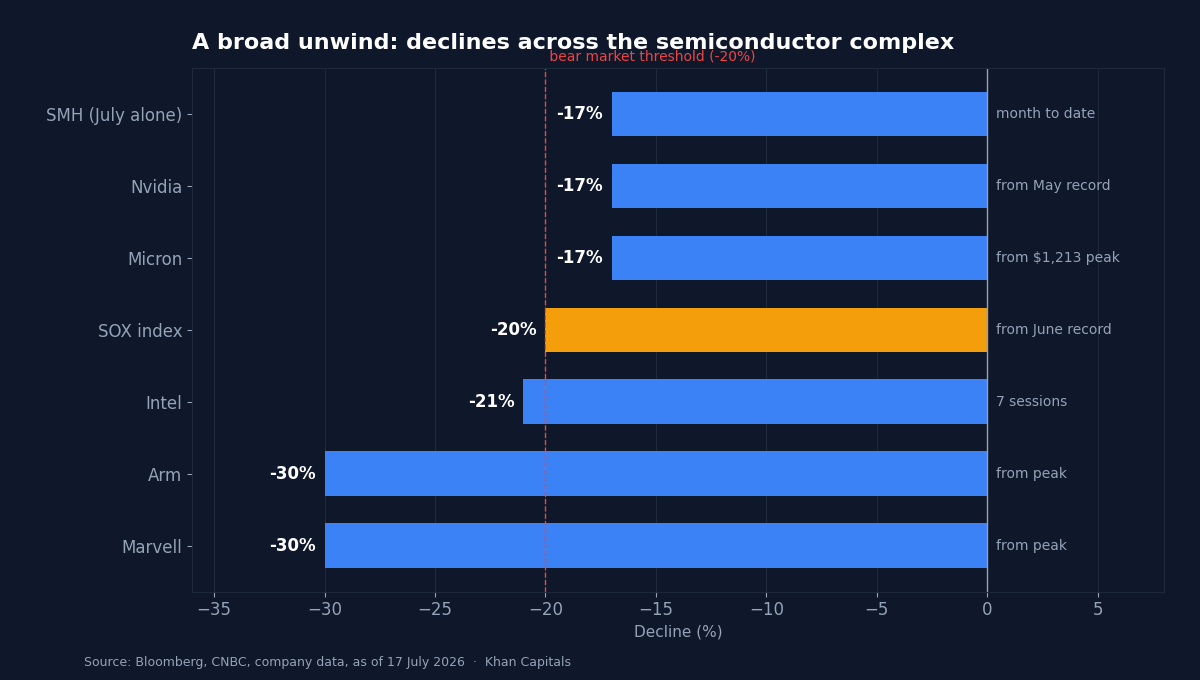
| Instrument | Decline | Measured from |
|---|---|---|
| Philadelphia Semiconductor Index | -20%+ | Late-June record close |
| VanEck Semiconductor ETF (SMH) | -17%+ | Month of July to date |
| Nvidia | -17% | May record high |
| Micron | -17% | $1,213 peak |
| Intel | -21% | Seven trading days |
| Marvell, Arm (each) | -30%+ | Respective peaks |
How the Semiconductor Bear Market Arrived
Nothing broke. That is the uncomfortable part. There was no earnings shock inside the sector, no hyperscaler cancelling orders, no export ban beyond the ones already priced. The semiconductor bear market of July 2026 was triggered by valuation, and by the arithmetic of what happens when a sector that has gained 65 per cent in six months meets a market no longer willing to underwrite perfect execution.
The reappraisal did not happen in isolation. Technology and growth stocks have now fallen for a fifth consecutive difficult week, with the S&P 500 down 1.6 per cent this week and the Nasdaq off 2.9 per cent. The proximate irritants are familiar: renewed hostilities between the United States and Iran have put the Strait of Hormuz back at the centre of the oil market, Brent has traded back above $80, and the rate market has revived the September hike debate we examined in our analysis of the repriced Fed path. Higher discount rates are a tax on long-duration cash flows, and no corner of the market carries more of its value in the distant future than AI infrastructure.
But macro alone does not explain a 20 per cent sector drawdown in three weeks. The catalyst was valuation; the structure underneath was crowding. By late June the semiconductor trade had become the consensus expression of the entire AI thesis, held in size by institutions, retail traders and leveraged vehicles simultaneously. When a position is that widely shared, the exit is narrow by construction.
Record Results, Falling Prices
What makes this episode unusual is the quality of the news the market is selling. In the past ten days alone, TSMC reported a record second quarter that beat its own guidance ceiling, SK Hynix completed the largest first-time US share sale by a foreign company and debuted 13 per cent higher, and Samsung guided to a record ₩89 trillion quarter and was sold anyway. Earnings season outside the sector has been strong as well, with S&P 500 earnings growth tracking above 20 per cent, led by the banks.
A market that sells record results is not disputing the results. It is disputing the price it previously paid for them. That distinction matters for what comes next. When prices fall because fundamentals are deteriorating, the bottom arrives when the fundamentals stop getting worse. When prices fall because the multiple is compressing, the bottom arrives when valuation meets the level at which marginal buyers return, a level that is discovered rather than forecast. The sector has been through this before: the memory downcycle of 2022 took the index down more than 35 per cent while long-run demand kept growing, and the late-2018 drawdown cut roughly a quarter off the sector inside a secular uptrend.
The one genuine earnings casualty of the fortnight, IBM’s record 25 per cent single-day fall, is instructive precisely because it was not an AI infrastructure story. IBM missed on consulting and software contracts. The market’s willingness to remove $68 billion of value over a 3.7 per cent revenue miss told investors something about the temperature of the tape, and the semiconductor complex, carrying far richer multiples, absorbed the lesson.
The Mechanics of the Exit
Flow data shows where the pressure is concentrated. Investors withdrew $7.18 billion from growth funds in the latest week while value funds absorbed $3 billion of inflows, one of the sharpest single-week style rotations of the year. Inside the semiconductor trade itself, the leveraged vehicles are being unwound fastest: the GraniteShares 2x Long Nvidia ETF bled $824 million and the Direxion Daily Semiconductor Bull 3x fund lost $270 million.

Two details in the flow picture argue against the apocalyptic reading. First, the unlevered VanEck fund actually recorded a large creation during the selloff, evidence that some investors are converting amplified exposure into plain exposure rather than leaving the theme. Second, the total pool of leveraged Nvidia ETF assets, roughly $5.6 billion against $28.8 billion of daily trading in the underlying shares, is modest relative to the crowding seen in some Asian chip names. Leverage amplified this decline; it did not cause it, and its capacity to force further selling shrinks with every session that unwinds it.
The $7.6 Trillion Question
Underneath the price action sits the same question this publication has returned to all year: not whether AI capital spending is real, but who earns a return on it. Goldman Sachs projects some $7.6 trillion of cumulative AI capital expenditure through 2031. The semiconductor industry is the toll collector on that spending, which is why the sector doubled in fifteen months. The July repricing is the market acknowledging that a decade of projected spending had been discounted into prices at a moment when the cost of capital was falling, and that both assumptions, the spending and the discount rate, now carry wider error bars.
The demand-side evidence has genuinely become more mixed. The shift we flagged when Meta moved to sell its excess compute, from scarcity pricing towards utilisation economics, has continued to work through the complex. When compute stops being scarce, the premium attached to everything that produces compute compresses, even if volumes keep growing. That is not a collapse in demand. It is a change in the distribution of profits along the supply chain, and equity markets reprice distribution changes violently because they change who deserves the multiple.
What the Rotation Is Saying
The other side of this trade deserves attention. The same week the chip index entered a bear market, banks reported their strongest quarter on record, BlackRock printed record assets, and value funds took in $3 billion. The equal-weight market has held up far better than the capitalisation-weighted indices. This is what a rotation looks like: capital moving from the most extended part of the market to the least, without leaving the market.
That breadth is the strongest argument that July 2026 is a bear market within a bull market rather than the start of something systemic. In 2018 the semiconductor drawdown coincided with a broad market decline and a Fed tightening into weakening growth. Today the tightening risk is real, but it is being driven by an oil shock and resilient nominal growth, and the earnings season outside technology is strong. The distinction does not make chip stocks cheap. It changes what has to go wrong for the drawdown to metastasise.
| Scenario | Key assumptions | Sector implication |
|---|---|---|
| Bull | Big-tech earnings reaffirm capex; oil retreats; September hike priced out | Multiple stabilises; drawdown resolves as consolidation within the cycle |
| Base | Capex holds but growth in guidance slows; rates stay elevated | Rangebound sector; leadership narrows to names with pricing power |
| Bear | A hyperscaler cuts capex guidance; hike delivered; oil above $90 | Second leg down; drawdown deepens towards the 2022 template |
The Chart to Watch
The VanEck Semiconductor ETF is the cleanest daily read on whether the unwind is exhausting itself. The level the market is watching is the June breakout zone: hold it, and the bear market case remains a valuation reset; lose it decisively, and the 2022 template comes into play.
Investor Implications
Equities. The burden of proof has shifted. For eighteen months, semiconductor investors were paid for owning the theme; from here, differentiation inside the complex matters more than exposure to it. Companies with contracted revenue, pricing power in genuinely scarce inputs and direct hyperscaler relationships have retained more of their gains than commoditised or leverage-favoured names, and that dispersion is likely to persist. The breadth of the wider market, with financials and value absorbing the rotation, argues against treating the chip drawdown as an index-level signal on its own.
Fixed income. The bond market is a cause here, not a bystander. A September hike moving into the price has lifted the discount rate on the longest-duration equities, and the correlation between yields and the chip complex has tightened accordingly. If the hike is delivered, or oil holds above $80 into the autumn, the pressure on long-duration valuations continues irrespective of earnings. Credit markets, notably, show little stress: this remains an equity multiple event, not a financing event.
Cross-asset. The most useful cross-check is the divergence between volatility markets and flow data. A disorderly unwind would show up in funding markets, credit spreads and index volatility simultaneously. So far the stress is contained to the sector and its leveraged wrappers. Watching whether that containment holds, particularly through the biggest earnings week of the quarter, tells an investor more than the daily price action does.
What to Watch
- Wednesday 22 July: the biggest earnings day of the week by market capitalisation, with thirty S&P 500 companies worth a combined $12.55 trillion reporting; hyperscaler capital spending commentary is the single most important input for the chip complex.
- Thursday 23 July: the European Central Bank’s rate decision, the first read on whether the oil shock is pushing other major central banks towards the Fed’s harder line.
- 30 to 31 July: the Bank of Japan meeting, with the policy rate at its highest since 1995 and the yen still the funding leg of much of the global growth trade.
- Mid-August: TSMC’s July monthly revenue release, the fastest hard-data check on whether AI orders are decelerating or merely being repriced.
- September FOMC: the meeting at which the revived hike is priced; delivery or removal of that expectation resets the discount rate applied to the entire trade.
Conclusion
The semiconductor bear market of July 2026 is best understood as the bill for eighteen months of being right. The AI infrastructure thesis worked so well, for so long, that the sector came to be priced for a world in which nothing, not rates, not oil, not the economics of compute, ever intruded. Three weeks of selling have removed that assumption, and roughly a third of the year’s gains with it.
What the selling has not removed is the spending. The order books, the capex budgets and the physical build-out that this publication has tracked all year remain in place, and the strongest results in the sector’s history keep arriving. The question the market is now pricing is narrower and harder: not whether the build-out happens, but what a share of it is worth when capital is no longer free and compute is no longer scarce. Bear markets within bull markets end when that question finds a clearing price. The next fortnight of hyperscaler earnings will go a long way towards setting it.
Frequently Asked Questions
Is the semiconductor sector officially in a bear market?
Yes, by the conventional definition. The Philadelphia Semiconductor Index closed more than 20 per cent below its late-June record on 17 July 2026, which is the standard threshold for a bear market. The decline took roughly three weeks, one of the fastest sector bear markets on record, and followed a rally of about 105 per cent from the March low.
Why are chip stocks falling if earnings are so strong?
Because the selloff is about valuation rather than results. TSMC, Samsung and SK Hynix all delivered record numbers in July, but the sector had already priced years of flawless growth. Rising oil prices, a possible September Fed rate hike and questions about the long-run economics of AI compute raised the discount rate applied to those future profits, compressing the multiples investors would pay.
Where is the money going?
Mostly into other parts of the equity market. Growth funds lost $7.18 billion in a week while value funds took in $3 billion, and leveraged semiconductor vehicles saw heavy redemptions while the unlevered VanEck fund recorded inflows. That pattern suggests a rotation and de-risking within equities rather than a flight out of them.
Does the AI capex cycle survive a chip bear market?
Share prices and capital budgets are different things. Goldman Sachs still projects trillions of dollars of cumulative AI capital spending through 2031, and no hyperscaler has cut its spending guidance. The 2018 and 2022 semiconductor drawdowns both occurred while long-run demand kept growing. The risk to watch is any change in hyperscaler capex guidance, which would convert a valuation event into a fundamental one.
Sources: Bloomberg, CNBC, The Motley Fool, Edward Jones, TS2 (ETF flow data), Clearbrook Global.
Related Reading: The paradox of record results meeting falling prices ran through SK Hynix’s $26.5 billion Nasdaq listing and the reopening of Nvidia’s China trade, while the structural argument that compute is shifting from scarcity to utilisation began with Meta’s AI cloud pivot. For the other side of the rotation, see Wall Street’s record quarter. For the fundamentals, start with what actually defines a bear market and how leverage amplifies every unwind. The rotation’s biggest beneficiary reported the same week: see BlackRock’s record AUM quarter. The season’s first verdicts on that repricing came with Alphabet’s $205 billion capex quarter and Tesla’s one-third profit miss. The sector’s latest print is analysed in Intel’s Q2 2026 earnings, the fastest growth in 15 years.

Leave a Reply