
Khan Capitals | September 2026
Key Takeaways
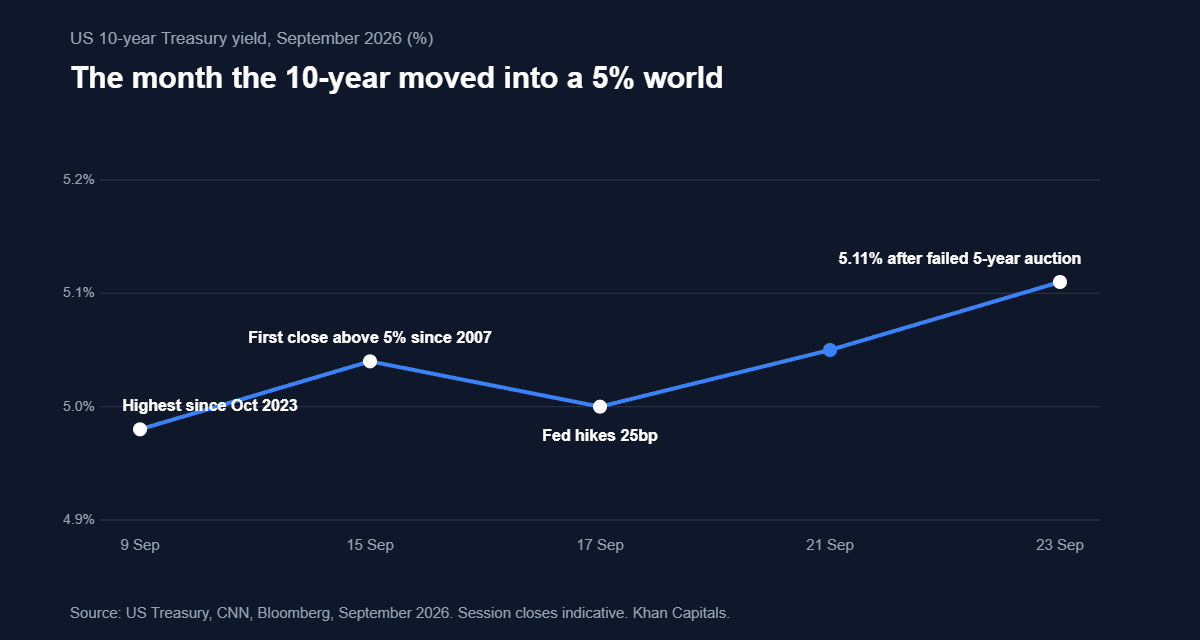
- The 10-year Treasury yield pushed above 5.11 per cent on Wednesday, its highest since 2007, as a weak $70 billion five-year auction drove yields across most maturities to near two-decade highs.
- The auction was the tell: the five-year note priced at 5.033 per cent with a 3.1 basis point tail, among the largest on record for the tenor, a bid-to-cover of 2.212, the weakest since 2018, and primary dealers left holding roughly 15.8 per cent of the paper.
- The macro data gave sellers cover: the composite PMI jumped to 58.4, the fastest business activity since 2021, Brent settled near $103, and hawkish Fed commentary reinforced bets on further hikes after last week’s first rise since 2023.
- Equities finally noticed: the S&P 500 fell 0.8 per cent and the Nasdaq 100 dropped 0.9 per cent as the discount rate on every long-duration asset repriced.
- This is not October 2023 repeated: the last touch of 5 per cent was a spike that faded within weeks; this one arrives with the Fed hiking rather than finishing, supply expanding, and the marginal foreign buyer pulling back.
Part of: Rates, Bonds & the Macro Picture — Khan Capital’s hub on the yield curve, central banks and the macro cycle.
The Auction That Confirmed the Regime
Milestones in the bond market usually arrive with a catalyst attached, and Wednesday’s was unusually clean: the US Treasury tried to sell $70 billion of five-year notes and found the world’s deepest capital market reluctant to take them. The 10-year Treasury yield, already grinding higher since the Federal Reserve’s hike, broke above 5.11 per cent in the aftermath, a level last seen in 2007. The move completed a repricing that began when the 10-year first closed above 5 per cent the previous week, and it answered the question that October 2023’s brief touch of 5 per cent left open: this time, the level is not a spike. It is the market’s new clearing price for lending to the United States for a decade.
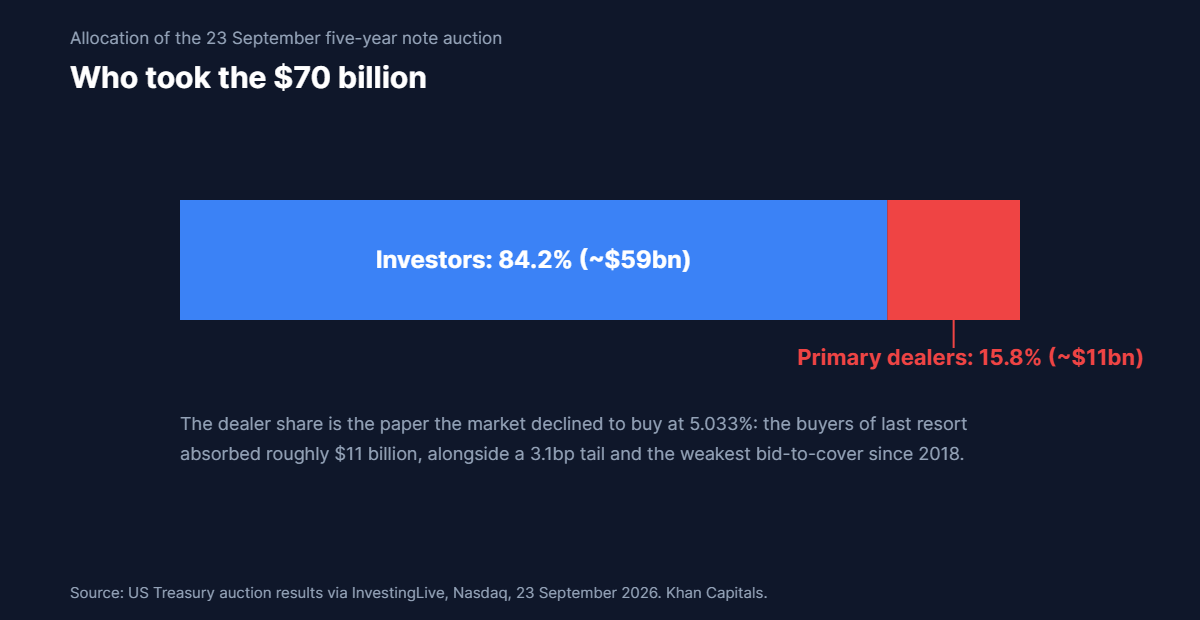
The auction’s internals matter more than the headline. The notes priced at a high yield of 5.033 per cent, tailing the when-issued level by 3.1 basis points, one of the largest tails ever recorded for the tenor. The bid-to-cover ratio slumped to 2.212, the weakest demand since 2018. Primary dealers, the buyers of last resort obliged to backstop auctions, absorbed roughly 15.8 per cent of the sale, leaving around $11 billion of unwanted supply on bank balance sheets. Each statistic says the same thing in a different dialect: at yields above 5 per cent, for a maturity as pedestrian as five years, real-money demand did not show up.
For a market that has spent the year absorbing record coupon issuance, an auction failure of degree, not kind, was enough to move everything. Yields rose across the curve to near two-decade highs, equities sold off, and the conversation shifted from whether 5 per cent would hold to what the world looks like if it does. That conversation is the subject of this piece.
How the 10-Year Treasury Yield Reached 5.11 Per Cent
The path to Wednesday ran through three reinforcing forces. The first is the Fed. Last week’s 25 basis point hike, the first since 2023, came with projections showing most of the committee expecting at least one more, and the days since have brought hawkish commentary from Fed officials including Governor Michael Barr. A central bank raising rates into an oil shock resets the floor under the entire curve.
The second is the data. Wednesday’s composite PMI printed 58.4, the fastest pace of US business activity since 2021, an extraordinary reading for an economy eighteen months into a tightening scare. Brent crude settling near $103 keeps the petrol-led inflation impulse alive. Together they gut the disinflation narrative that justified owning duration at 4 per cent: an economy accelerating with oil above $100 is not one heading for rate cuts, and the bond market has stopped pricing them on any near horizon.
The third force is supply meeting a thinner buyer base, and it is the one the auction exposed. The deficit requires the Treasury to sell historic volumes of coupons whether or not buyers are enthusiastic; the Treasury’s own $6 billion buyback operations, tripled this month to steady the long end, are a fraction of weekly issuance. Meanwhile the structural bid is eroding from several directions at once: Japanese institutions face domestic yields near 3 per cent for the first time since 1996, making repatriation rational; foreign official demand has flattened; and the banking system, post-2023, holds duration reluctantly. When the marginal buyer becomes a primary dealer taking paper under obligation, the price of money is being discovered rather than managed.
Reading the Auction: A Buyers’ Strike in Miniature
Auction tails are the bond market’s polygraph. A tail means the market-clearing yield came in above where the market itself was trading the security minutes before: bidders demanded extra compensation to take down the supply, and the size of the tail measures their reluctance. At 3.1 basis points on a five-year note, Wednesday’s was among the largest on record for the tenor, behaviour associated with stress events rather than routine funding. The bid-to-cover of 2.212, the lowest since 2018, says the order book was shallow, not merely price-sensitive. And the dealer take of 15.8 per cent quantifies the gap between the supply on offer and the demand that exists at these prices.
The five-year tenor makes the message sharper. The long bond can fail on term premium arguments alone; the five-year is the curve’s centre of gravity, the maturity pension funds, banks and foreign reserves managers buy by default. Weak demand there is not a bet about 2056; it is a statement about the price of US credit and inflation risk over a horizon everyone must hold. It echoes the pattern of August’s synchronised selloff, when four sovereign markets hit multidecade yield highs in a single week: the problem is not one auction or one country, but a global repricing of duration in a world of structural deficits.
It is worth being precise about what did not happen. The auction cleared; the United States funded itself; there was no failed sale. Markets’ capacity to absorb Treasury supply is not in question at some price. What Wednesday established is that the price is higher than almost anyone modelled at the start of the year, and that each incremental $70 billion now moves the level rather than disappearing into it.
| Auction metric | Result, 23 September 2026 | Read |
|---|---|---|
| Size / tenor | $70bn five-year notes | Routine mid-curve supply |
| High yield | 5.033% | Five-year money above 5% for the first time in the cycle |
| Tail | 3.1bp above when-issued | Among the largest on record for the tenor |
| Bid-to-cover | 2.212 | Weakest demand since 2018 |
| Primary dealer take | ~15.8% (roughly $11bn) | Buyers of last resort forced to absorb supply |
| 10-year yield after | Above 5.11% | Highest since 2007 |
Why This Is Not October 2023
The last time the 10-year touched 5 per cent, in October 2023, the moment became a famous buying opportunity: the bond vigilantes’ return lasted roughly a week before a dovish Fed pivot and a Treasury issuance tweak sent yields down 100 basis points in two months. The muscle memory from that episode explains why many investors have treated every approach to 5 per cent since as a gift. The 2026 version differs in each respect that made 2023 reversible.
Then, the Fed was finished hiking and said so; now it has just restarted, with the dots pointing higher and inflation reaccelerating on energy. Then, inflation was falling quickly toward target; now headline CPI sits at 3.4 per cent with oil above $100. Then, the Treasury could shift issuance toward bills to relieve coupon pressure; that lever has been pulled for three years, and bills are already a historically large share of the stock. Then, foreign and domestic real money bought the dip within days; now the five-year auction shows them stepping back at higher yields than 2023 offered. The direction of every variable that rescued the 2023 bond market has reversed. That does not make 5 per cent a ceiling or a floor; it makes it a level the market must genuinely trade around rather than bounce from.
| Variable | October 2023 touch of 5% | September 2026 break above 5.1% |
|---|---|---|
| Fed direction | Finished hiking; dovish pivot weeks away | Just restarted hiking; dots point higher |
| Inflation trend | Falling quickly toward target | Reaccelerating; headline CPI 3.4% with Brent near $103 |
| Issuance lever | Shift to bills relieved coupon pressure | Bill share already historically high; lever largely spent |
| Buyer response | Real money bought the dip within days | Weakest five-year bid-to-cover since 2018; dealers absorb |
| Aftermath | Yields fell ~100bp in two months | Open; the forces that produced the level persist |
The Term Premium World
Decomposed, the move above 5 per cent is not primarily a bet on the federal funds rate. Markets price a terminal rate well below the 10-year yield; the gap is term premium, the extra compensation investors demand for holding long duration in a world of fiscal expansion, sticky inflation and unreliable buyers. Term premium spent most of the 2010s negative, because central bank buying and disinflation made duration a hedge. It has now rebuilt to levels last sustained before the financial crisis, and Wednesday’s auction shows the rebuild is demand-driven, not theoretical.
A durable term premium changes asset pricing arithmetic everywhere. It raises the discount rate on equities independent of Fed policy, which is why the S&P 500’s fall on Wednesday tracked the auction rather than any earnings news. It resets mortgage and corporate borrowing costs off a higher base. And it changes the fiscal arithmetic that caused it: every refinancing at 5 per cent compounds the deficit that produces the supply that sustains the premium. This loop, deficit to supply to yield to interest cost to deficit, is the mechanism investors mean when they talk about fiscal dominance, and September’s bond market is the cleanest illustration of it since the gilt crisis of 2022.
The global dimension tightens the loop. The BoJ’s tightening pulls Japanese capital home; the ECB’s hikes give European investors domestic alternatives; and every developed sovereign is issuing heavily into the same buyer base. The US is not being singled out. It is simply the largest borrower in a world where lenders have regained pricing power for the first time in a generation.
What 5 Per Cent Does to Everything Else
A 10-year yield above 5 per cent is a gravitational constant for every other asset. For equities, it compresses the premium investors receive for taking equity risk: with a genuine risk-free 5 per cent available, the hurdle for owning long-duration growth stories rises, and Wednesday’s underperformance of the Nasdaq against the S&P is the standard signature. For credit, absolute all-in yields become historically attractive even as spreads stay tight, pulling flows from equities into investment grade. For housing, mortgage rates anchored off the 10-year press further into demand that has already frozen transaction volumes. And for governments everywhere, it prices fiscal room they had planned to spend.
The offsetting fact, easy to lose in a selloff, is that high starting yields are the best predictor of future bond returns. An investor buying the 10-year at 5.1 per cent needs no rally to earn more than equities’ long-run average with sovereign credit risk; the asymmetry that punished bondholders for three years has partially inverted. The question is timing: catching the level while the Fed is still hiking, oil is rising and auctions are tailing means accepting mark-to-market pain for the entry point. October 2023 rewarded that trade within weeks. The argument of this piece is that the reward, if it comes, will take considerably longer this time.
Investor Implications
Equities. The equity market’s tolerance for 5 per cent yields depends on why yields are there: growth-driven rises are survivable, term-premium rises are not comfortable. Wednesday’s combination, strong PMI but a failed auction, contains both, which argues for the barbell that has worked all month: cash-generative quality on one side, energy on the other, with long-duration growth carrying the repricing risk. Banks gain on reinvestment yields but carry duration losses on securities books; the 2023 regional bank stress is the reference case if the move accelerates.
Fixed income. The front of the curve is the comfortable trade: bills near the policy rate with hikes still possible. Extending duration at 5 per cent is a genuine long-term proposition with an uncomfortable path; scaling in beats calling the top in yields. Auction internals are now first-order market data: tails, bid-to-cover and dealer take on each coupon sale will move markets the way CPI prints did in 2022-23. Inflation-linked paper hedges the scenario where oil keeps the pressure on.
Cross-asset. The bond market is transmitting tightening the Fed has not delivered: every 10 basis points of term premium does policy work without a vote. That raises the odds the Fed’s own path proves shorter than the dots imply, which is the eventual bull case for duration. Meanwhile the assets that benefit from sovereign stress, gold near records and bitcoin at eight-month highs, are behaving exactly as the fiscal-dominance thesis predicts. Their correlation with bad auctions deserves a place on every risk dashboard.
What to Watch
- This week: the remaining coupon auctions of the month, starting with the seven-year note; a second consecutive large tail would confirm the buyers’ strike, a clean sale would calm it.
- Friday 25 September: the August core PCE print, the Fed’s preferred gauge; a hot reading with the PMI at 58.4 would lock in expectations of another hike and test 5.25 per cent on the 10-year.
- Late October (expected): the Fed’s next meeting and, around it, the Treasury’s quarterly refunding announcement; any shift in the coupon-bill issuance mix is the fastest lever Washington has to relieve the long end.
- Ongoing: Japanese investment flows and JGB yields; the closer the 10-year JGB sits to 3 per cent, the weaker the structural foreign bid for Treasuries.
Conclusion
The 10-year Treasury yield at 5.11 per cent is the price the world now charges its safest borrower, set not by a central bank meeting but by a shortfall of bids at an ordinary Wednesday auction. That is the significant part. Policy rates are chosen; clearing prices are discovered, and what the five-year sale discovered is that the buyers who anchored two decades of cheap sovereign funding, foreign reserves, Japanese institutions, price-insensitive banks, now require persuasion.
For investors the level offers a genuine opportunity and an honest warning. The opportunity is arithmetic: starting yields above 5 per cent have historically been generous entry points, and duration bought here needs nothing heroic to perform over a decade. The warning is the path: with the Fed hiking, oil above $100, activity accelerating and supply relentless, the forces that produced 5.11 per cent have not finished. The 5 per cent world has arrived. The market is still negotiating the rent.
Frequently Asked Questions
Why are Treasury yields rising in September 2026?
Three forces are reinforcing each other: the Federal Reserve has restarted rate hikes with projections pointing higher; the data is strong, with business activity at a five-year high and oil near $103 keeping inflation pressure alive; and Treasury supply is meeting weaker demand, demonstrated by the poor $70 billion five-year auction that tailed by 3.1 basis points with the weakest bid-to-cover since 2018.
What is an auction tail and why does it matter?
A tail is the gap between the yield at which an auction clears and the level where the security traded just before the sale. A large tail means bidders demanded extra yield to absorb the supply, signalling weak demand. Wednesday’s 3.1 basis point tail on the five-year note was among the largest on record for that maturity, which is why it moved the whole bond market.
When was the 10-year Treasury yield last above 5 per cent?
Before this month, the 10-year briefly touched 5 per cent in October 2023 and then fell sharply as the Fed turned dovish. For a sustained period above 5 per cent, the comparison is 2007, before the financial crisis. The 2026 episode differs from 2023 because the Fed is hiking rather than finishing, inflation is reaccelerating and demand at auctions is weakening.
What do 5 per cent yields mean for stocks and mortgages?
Higher risk-free yields raise the discount rate on future corporate earnings, which pressures equity valuations, particularly long-duration growth stocks; the S&P 500 fell 0.8 per cent and the Nasdaq 100 0.9 per cent as the 10-year broke 5.11 per cent. Mortgage rates, which price off the 10-year, rise in tandem, extending the freeze in housing transaction volumes.
Sources: CNN Business, 10-year Treasury yield hits 5.1% for first time in 19 years; InvestingLive, US Treasury sells $70 billion of 5-year notes at a high yield of 5.033%; Nasdaq, Five-year note auction attracts below average demand; Bloomberg, Stock Market Today, 23 September 2026; CNBC, Stock market news, 23 September 2026; The Motley Fool, Stocks slip as Treasury yields hit 19-year high.
Related Reading: The supply-demand strain has been building all quarter: August’s global bond selloff put four sovereign markets at multidecade highs and the Treasury tripled its buybacks trying to steady the long end. The policy fuel came from the Fed’s first hike since 2023, while our account of October 2023’s brief touch of 5 per cent shows how differently the last visit to this level ended. For the fundamentals, start with our term premium explainer and duration explained.

Leave a Reply