
Khan Capitals | September 2026
Key Takeaways
- Payrolls tripled expectations. The US economy added 162,000 jobs in August against a consensus near 53,000, the strongest monthly gain since March and more than five times the 31,000 average of the prior twelve months, according to the Bureau of Labor Statistics.
- July’s decline vanished. The month that printed at minus 23,000, the first negative payrolls reading in 53 months and the anchor of the summer slowdown narrative, was revised up by 44,000 to plus 21,000. June was lifted to 31,000, leaving the two months 55,000 stronger than first reported.
- Hike odds jumped from a coin flip to 60 per cent. Futures pricing on the CME FedWatch tool moved from an even split to roughly a 60 per cent probability of a quarter-point increase at the September meeting, with two-year Treasury yields rising four basis points to 4.37 per cent.
- The composition was narrow. Food services (+59,000) and local government education (+42,000) supplied more than 60 per cent of the gain, while information employment fell 23,000, including losses in computing infrastructure and data processing.
- Wages stayed contained. Average hourly earnings rose 0.3 per cent on the month and 3.1 per cent on the year, leaving the inflation impulse from labour costs modest even as oil near $95 keeps headline pressure elevated.
Part of: The Fed’s Regime Change — Khan Capital’s hub on the 2026 shift from cuts to hikes.
The August Jobs Report Lands a 109,000-Job Surprise
The August jobs report was supposed to confirm a cooling labour market. Instead it delivered the largest upside payrolls surprise of the year: 162,000 jobs added against a consensus forecast of roughly 53,000, with the unemployment rate holding at 4.1 per cent and 7.0 million people unemployed. For a market that spent August debating whether the Federal Reserve could afford to sit still while oil-driven inflation builds, the answer arrived in one line of the Bureau of Labor Statistics release: the labour market is not rolling over.
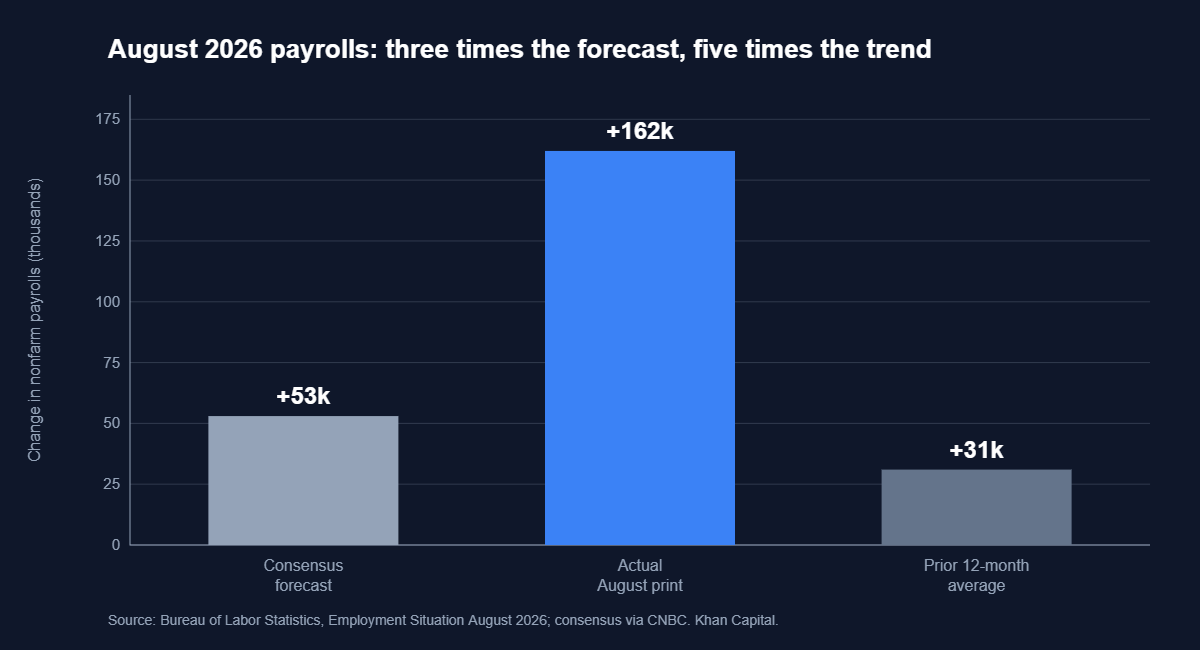
Context matters here. Over the twelve months to July, payroll growth averaged just 31,000 a month, a pace weak enough that a single soft print could plausibly have tipped the narrative towards recession. August did not just beat expectations; it printed at more than five times that trailing average. The report reframes the labour market story from one of gradual exhaustion to one of a low-hiring, low-firing economy that can still produce a strong month when seasonal hiring and public-sector payrolls align.
The Decline That Never Happened
The more consequential number sat further down the release. July’s initial print of minus 23,000, the first monthly payrolls decline in 53 months, was revised up by 44,000 to plus 21,000. June was revised from 20,000 to 31,000. Together the two months now stand 55,000 higher than first reported. The single data point that did most to build the case for a softening economy, one that collapsed September hike odds when it landed in early August, has been revised out of existence.
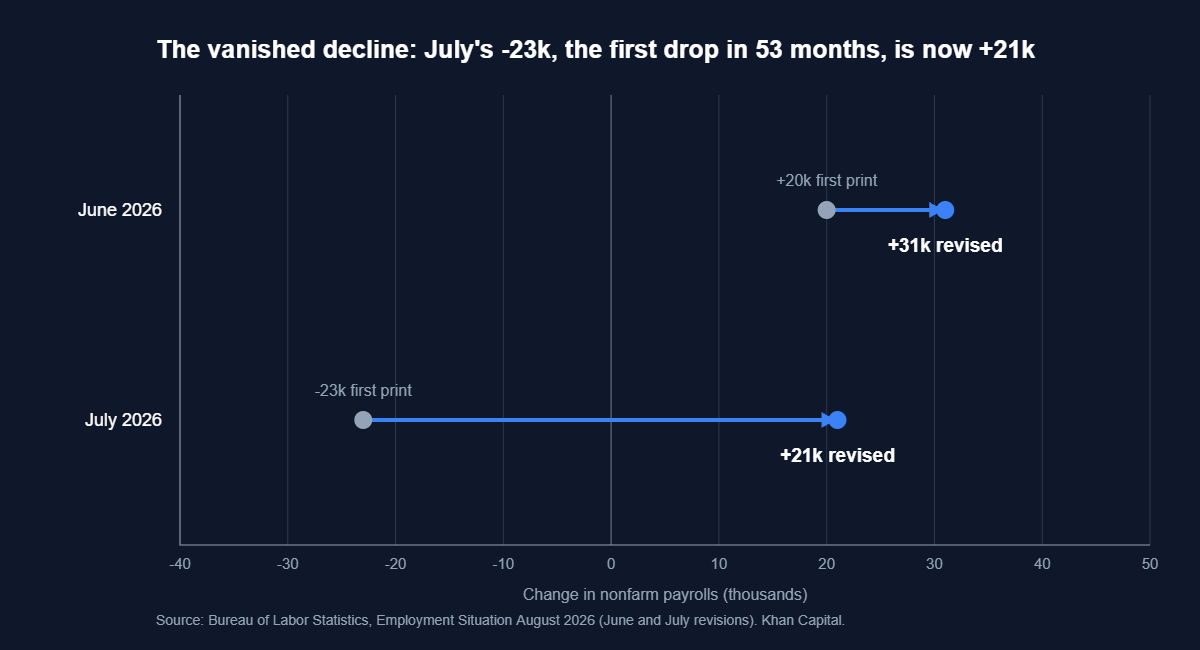
This is not a small technical footnote. An entire month of positioning was built on the minus 23,000 print. Rate hike probabilities fell sharply after it, short-end yields rallied, and commentary converged on the view that the Fed’s window for tightening had closed. Every one of those trades was anchored to a number that no longer exists. Payroll revisions result from late-arriving business and government survey responses and recalculated seasonal factors, and in periods of economic inflection they tend to be larger and more directional. Readers who want the mechanics can start with our explainer on how the monthly jobs figures are assembled and revised; the practical lesson for this cycle is that first prints near zero carry unusually wide error bands, in both directions.
The revision also rehabilitates part of the case made at Jackson Hole. When the incoming Fed leadership signalled in late August that policy might need to lean against oil-driven inflation rather than cushion a softening labour market, the objection was that hiking into a shrinking jobs market would be a policy error. If the jobs market was never shrinking, that objection loses much of its force.
Where the Jobs Came From
The sector detail complicates the headline. More than 60 per cent of August’s gain came from two places: food services and drinking places, which added 59,000 jobs against a twelve-month average of 12,000, and local government education, which added 42,000 in what the BLS describes as largely an offset to July’s decline. Manufacturing continued its recovery with 16,000 new jobs, taking the sector’s gain since its December 2025 low to 58,000, and construction added 22,000.
| Sector | August change | Context |
|---|---|---|
| Food services and drinking places | +59,000 | Nearly five times the 12-month average of +12,000 |
| Local government education | +42,000 | Largely offsets July’s decline; little net change since January 2025 |
| Construction | +22,000 | Nonresidential specialty trades continue to trend up |
| Manufacturing | +16,000 | Up 58,000 since the December 2025 low |
| Health care | +13,000 | Well below the 12-month average of +32,000 |
| Information | -23,000 | Losses in computing infrastructure, data processing and publishing |
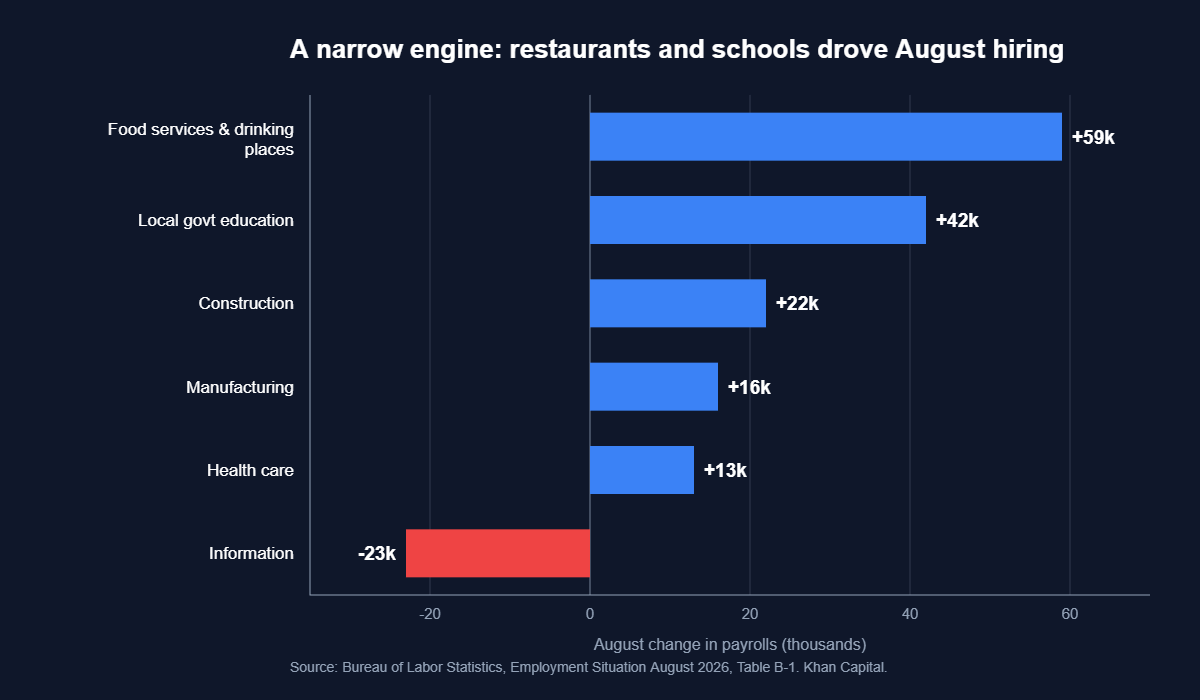
Two details deserve more attention than they received on the day. First, health care added just 13,000 jobs against a twelve-month average of 32,000. Health care has been the single most reliable engine of US job creation this cycle; a sustained slowdown there would remove the floor under trend payrolls growth. Second, the information sector lost 23,000 jobs, with 8,000 of the losses in computing infrastructure, data processing and web hosting. In a year defined by an AI infrastructure boom, the sector that houses it is shedding workers, a reminder that data centre capex builds machines, not headcount.
Wages, Hours and the Inflation Arithmetic
For all the strength in hiring, the wage side of the report stayed calm. Average hourly earnings rose 10 cents, or 0.3 per cent, to $37.75, leaving the annual rate at 3.1 per cent. The average workweek edged up to 34.4 hours. A 3.1 per cent wage trend is broadly consistent with the Fed’s inflation target once productivity is accounted for, which means the labour market is not, on this evidence, the source of the inflation problem.
The inflation problem sits elsewhere. Brent crude near $95 a barrel, up roughly 45 per cent on a year ago amid the Gulf escalation, is feeding through to headline prices globally, and the hot July PCE print showed the pass-through is no longer hypothetical. That is what makes August’s payrolls number so consequential: it removes the last data-based argument for the Fed to look through the oil shock. A central bank worried about hiking into labour market weakness now has a labour market that, on the revised data, never weakened.
From Coin Flip to 60 Per Cent: the September Repricing
Markets moved quickly. Futures pricing tracked by the CME FedWatch tool shifted from an even 50/50 split before the release to roughly a 60 per cent probability of a quarter-point hike at the September meeting. Two-year Treasury yields, the purest expression of near-term policy expectations, rose four basis points to 4.37 per cent. Equities initially sold off on the good-news-is-bad-news logic that has governed this summer, with the Dow falling around 300 points in early trading, before the week’s gains left the major indices higher overall.
The two-year’s grind higher tells the cleaner story: the market is no longer debating whether the tightening cycle resumes, only how far it runs. A 60 per cent probability is not certainty, and the gap between 60 and 100 will be closed, or reopened, by the August CPI print that lands the week before the decision. But the burden of proof has flipped. In early August, the data had to justify a hike. After this report, the data has to justify a hold.
What the Strong Print Conceals
The case for caution has not disappeared; it has moved into the details. The labour force participation rate, at 61.6 per cent, is still down half a percentage point since January, meaning some of the unemployment rate’s stability reflects people leaving the workforce rather than finding jobs. Trend payrolls growth over the past year remains 31,000 a month, a fraction of the 150,000 to 200,000 once considered normal. And the two sectors that carried August, restaurants and local schools, are respectively volatile and seasonal, not the stuff of durable expansions.
There is also an uncomfortable reading of the composition for the AI trade. If computing infrastructure is shedding jobs while capex runs at record levels, the employment dividend of the buildout is negative even before any displacement effects are counted. That does not undermine the investment case for the infrastructure itself, but it does mean the labour market will offer little early warning if the AI capex cycle turns.
Two Paths for the September Meeting
With the FOMC decision due mid-month, the distribution of outcomes now looks like this.
| Scenario | Trigger | Likely market response |
|---|---|---|
| 25bp hike (market-implied ~60%) | August CPI confirms oil pass-through; no payrolls contradiction | Short-end yields rise further; curve flattens; rate-sensitive equities lag; dollar bid |
| Hawkish hold (~40%) | Soft CPI or renewed dissent about hiking with participation falling | Relief rally in duration and equities; easing of dollar strength; hike pricing rolls to October |
| Tail: 50bp or inter-meeting signal | CPI surprise materially higher on energy pass-through | Sharp bear flattening; equity drawdown led by long-duration growth |
Investor Implications
Equities. A labour market strong enough to absorb a hike is, on its own, an earnings positive: consumer-facing sectors got 59,000 new restaurant pay packets to spend. But the equity market’s summer melt-up was built partly on the assumption that the tightening cycle was finished. Sectors that led on that assumption, long-duration growth, housing-linked names already hit by weak construction spending, and small caps carrying floating-rate debt, face the most direct repricing risk if the September hike lands. Banks and insurers, by contrast, tend to benefit from a steeper short end.
Fixed income. The front end has already moved, but 4.37 per cent on the two-year still embeds meaningful probability of the cycle stopping at one hike. If the Fed frames September as the start of a mini-cycle rather than a one-off insurance move, there is room for further short-end repricing. Duration remains hostage to the global backdrop: with Japanese ten-year yields above 3 per cent for the first time since 1996 and term premia rebuilding worldwide, the global bond selloff limits how much shelter long Treasuries can offer even in a US slowdown.
Cross-asset. The dollar is the cleanest expression of the divergence trade: a Fed hiking on strong data while others tighten reluctantly into fiscal strain. Gold’s record run now faces a test from rising real yields, and crypto, which traded through August as a rate-cut proxy, inherits the same vulnerability. Oil remains the wild card in both directions, driving the inflation that forces the hike and the growth drag that could eventually reverse it.
What to Watch
- Week of 7 September: the August CPI release, the last major inflation print before the decision. The oil pass-through into core goods and airfares is the line to read first.
- 15 to 16 September: the FOMC meeting. Beyond the decision itself, the statement’s characterisation of the labour market (“solid” versus “moderating”) will signal whether this is a one-off or the start of a sequence.
- Late September: the August PCE release, the Fed’s preferred gauge, which set this repricing in motion when the July print ran hot.
- 2 October: the September jobs report. After this month’s revision lesson, the July and August revisions in that release matter as much as the headline.
Conclusion
The August jobs report did two things at once: it delivered a genuine upside surprise, and it retroactively deleted the data point on which the entire summer slowdown narrative rested. A labour market adding 162,000 jobs with 3.1 per cent wage growth is neither booming nor breaking; it is strong enough to let the Federal Reserve act on the inflation it can see rather than the weakness it feared. That makes the September meeting live in a way few expected a month ago, and it makes the next CPI print the most important data release of the quarter. The deeper lesson is about epistemics rather than economics: in an economy running close to stall speed, single payroll prints, and the trades built on them, deserve wider error bands than markets have been giving them.
Frequently Asked Questions
How many jobs did the US economy add in August 2026?
Total nonfarm payrolls rose by 162,000 in August 2026, according to the Bureau of Labor Statistics, far above the consensus forecast of roughly 53,000. It was the strongest monthly gain since March and compares with an average of 31,000 a month over the prior twelve months. The unemployment rate held at 4.1 per cent.
Why was the July payrolls revision so important?
July was initially reported as a 23,000 job decline, the first negative payrolls print in 53 months, and it drove expectations of Fed easing. The August report revised July up by 44,000 to a gain of 21,000, while June was revised up to 31,000. The data point that anchored the summer slowdown narrative effectively no longer exists.
Will the Federal Reserve raise interest rates in September 2026?
Nothing is decided, but market pricing moved from an even split to roughly a 60 per cent probability of a quarter-point hike after the jobs report. The August CPI release, due the week before the meeting on 15 to 16 September, is the main remaining input. A strong labour market removes the principal argument against tightening.
Was the August jobs report strong across the economy?
No. Food services (+59,000) and local government education (+42,000) supplied more than 60 per cent of the gain. Health care hiring slowed to 13,000 against a 32,000 average, and the information sector lost 23,000 jobs, including in computing infrastructure and data processing. Labour force participation, at 61.6 per cent, is down half a point since January.
Sources: Bureau of Labor Statistics, The Employment Situation, August 2026; CME FedWatch Tool; CNBC, August 2026 jobs report preview; Kiplinger, What a blowout August jobs report means for a September rate hike; Fox Business, US jobs report August 2026; Federal Reserve, FOMC meeting calendar.
Related Reading: The hike debate this report reignited began with the hot July PCE print and Warsh’s Jackson Hole warning, and the odds it revived are the same ones that collapsed after July’s original minus 23,000 print. For the policy backdrop, see our coverage of Jackson Hole 2026, and for why strong data now moves global yields, the global bond selloff. For the fundamentals, start with how the US jobs report works and why payroll numbers get revised. For the other side of the split economy, see Lululemon’s guidance cut the same week. On the household side, consumer confidence has since fallen to a 12-year low. One month later, September’s 29,000-job print revised much of this report away.

Leave a Reply