
Khan Capitals | July 2026
Key Takeaways
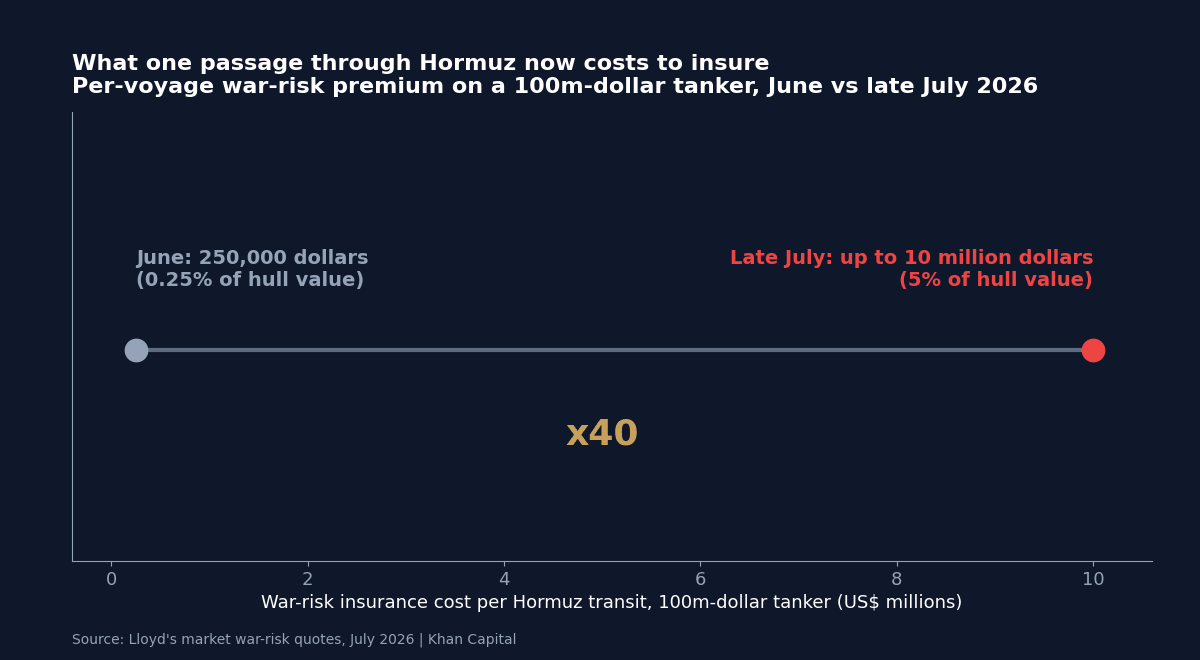
- War-risk insurance for a Strait of Hormuz transit has repriced from roughly 0.25 per cent to as much as 5 per cent of hull value, a rise of around 1,900 per cent that dwarfs crude’s own move. On a $100 million tanker, one passage now costs up to $10 million to insure.
- The volume response has been dramatic: transits through Hormuz fell to 127 vessels in the week to 19 July, roughly half normal traffic, after Iranian cruise missile strikes on two Adnoc-operated tankers killed a sailor and injured eight.
- Brent has risen about 30 per cent from its early-July lows to trade near $92, with the first prints above $90 of the crisis arriving as the US campaign against Iran intensified and Goldman Sachs warned of $120 crude in a prolonged blockade scenario.
- The blockade is economic, not naval. No mine has closed the strait; underwriters have. When insurance costs $10 million per voyage, marginal shipments stop making commercial sense, which throttles flow as effectively as force and far more deniably.
- Insurance is pricing what futures are not. Underwriters commit capital against named, present dangers; the futures curve trades probabilities and SPR releases. When the two diverge by an order of magnitude, the physical market is usually telling the truer story.
Part of: The 2026 Iran Crisis – Khan Capital’s hub on the 2026 Iran crisis and oil shock.
The Number That Moved 1,900 Per Cent
On the day Brent crude rose 4 per cent, the war risk insurance premium for a Strait of Hormuz transit rose by a multiple that made the oil move look like noise. Cover that cost roughly 0.25 per cent of a vessel’s hull value in June is now being quoted at up to 5 per cent, an increase of about 1,900 per cent. In cash terms, insuring a single $100 million tanker for one passage has gone from around $250,000 to as much as $10 million. Shipowners deciding whether to sail the strait are no longer weighing an incidental cost line; they are weighing a tenth of the ship’s value against the margin on one cargo.
The trigger was specific and lethal. In mid-July, Iranian cruise missiles struck two Adnoc-operated tankers, the Mombasa and the Al Bahyah, in and around the strait, killing one seafarer and injuring eight. For underwriters, that converted Hormuz from a theatre of elevated risk into a zone of demonstrated, targeted attacks on commercial shipping, and the quotes moved accordingly. Some insurers have simply withdrawn cover for the area rather than price it, the same dynamic that in earlier phases of this conflict ended the US-Iran truce in practice before it ended on paper.
An Invisible Blockade
The strait remains physically open. Warships have not closed it; no minefield spans it. And yet tanker transits fell to 127 vessels in the week ending 19 July, down nearly 50 per cent, because a waterway can be closed economically long before it is closed militarily. When insurance consumes the entire economics of a voyage, and when charterers cannot find cover at any price, sailings stop. The result is a blockade with no blockading fleet: deniable, granular, and adjustable by the week as underwriters reprice.
This is the mechanism the July escalation has made visible, and it matters for how investors should read the conflict. Iran does not need to win a naval engagement to impose costs on the global economy; it needs to sustain just enough demonstrated threat to keep premiums prohibitive. Conversely, de-escalation would show up in insurance quotes and transit counts days before it showed up in any communiqué. The fastest, least manipulated indicators of this war’s economic intensity are now published by the Lloyd’s market and the tanker trackers, not by any government.

Thirty Per Cent in Three Weeks: The Crude Move in Context
Brent has climbed from around $72 at the start of July to trade near $92, with the crisis’s first prints above $90 arriving after confirmed American deaths and the resumption of strikes. WTI has moved through $84. A 30 per cent rally in three weeks is a genuine shock; it is also, measured against the scale of the disruption, restrained. Hormuz carries roughly a fifth of the world’s oil. Traffic through it has halved. In 2022, a war involving a producer of comparable importance took Brent briefly toward $130 on anticipatory fear alone; in July 2026, with tankers actually being hit, the market sits at $92.
The restraint has reasons. Strategic reserves have been deployed repeatedly through this conflict, OPEC members with spare capacity outside the Gulf route have signalled willingness to pump, demand in a slowing global economy is soft, and traders have learned across eighteen months of this war that spikes mean-revert once each escalation plateaus. Goldman Sachs’s warning that a prolonged blockade could push Brent past $120 in the fourth quarter is best read in that light: not a forecast, but a statement of what the futures curve is currently declining to price. The gap between $92 and $120 is the market’s estimate of de-escalation, reserve releases and demand destruction, netted into one number.
| Indicator | Early July | Week of 19-22 July |
|---|---|---|
| Brent crude | ~$72 | ~$89-92, first $90+ prints of the crisis |
| WTI crude | ~$66-68 | $83-84, five-week highs |
| Hormuz transits (weekly) | ~250 vessels | 127 vessels, down ~50% |
| War-risk premium (share of hull) | ~0.25% | Up to 5% |
| Cost to insure $100m tanker, one transit | ~$250,000 | Up to $10m |
| Tanker attacks | Sporadic | Mombasa and Al Bahyah struck; one killed, eight injured |
Why Insurance Prices Truth Faster Than Futures
The divergence between a 4 per cent oil move and a 1,900 per cent insurance move on the same day is not a paradox; it is two markets answering different questions. The futures market prices the probability-weighted path of global supply and demand, incorporating SPR releases, OPEC spare capacity, demand elasticity and the historical tendency of war premiums to decay. The insurance market answers a narrower question with real capital: what is the chance that this specific ship, on this specific route, this week, is hit? Underwriters cannot diversify across scenarios; they pay actual claims on actual hulls, and their pricing therefore responds to demonstrated capability and intent rather than to narratives about de-escalation.
History suggests taking the narrower market seriously. Marine insurance repriced ahead of the oil market in the tanker wars of the 1980s, and insurers’ withdrawal of cover has repeatedly been the proximate cause of trade stopping, from the Red Sea diversions of 2024 to this month’s Hormuz contraction. When the market that pays claims and the market that trades paper diverge by an order of magnitude, the claims-paying market is usually early and the paper market is usually comfortable. That was the pattern when Washington briefly tried to monetise the strait a week earlier: the policy lasted a day, the premiums it validated did not.
Who Absorbs a Ten Million Dollar Transit
The premium has to land somewhere, and the incidence is instructive. Gulf producers selling on free-on-board terms push the cost onto buyers; refiners in Asia, the strait’s dominant customers, either pay up, seek alternative barrels priced off routes that avoid Hormuz, or run down inventories. Freight rates for the vessels still willing to sail have surged, a windfall for owners with nerve and a tax on everyone downstream. Retail fuel prices across importing economies have begun climbing as the disruption feeds through product markets, which is precisely the channel that keeps central banks trapped between inflation and growth on both sides of the Atlantic.
The second-order effects are quieter but larger. A sustained halving of Hormuz flow reorders the entire logistics of Asian energy security: pipeline routes that bypass the strait, Saudi and Emirati export infrastructure on the Red Sea and Gulf of Oman, and long-haul Atlantic basin crude all gain strategic value with every week the premium holds. Energy security, an abstraction in peacetime, is being repriced as a hard asset class in real time.
| Scenario | War-risk premium | Transits and flow | Crude read |
|---|---|---|---|
| De-escalation | Decays below 2% of hull within weeks | Traffic normalises toward ~250/week | Premium unwinds toward the $70s; the pattern of every prior 2026 plateau |
| Frozen conflict | Holds at 3-5%; cover scarce but available | Flow stabilises near half of normal; reroutes and pipelines absorb some volume | Brent ranges high-$80s to $90s; inflation pass-through builds |
| Blockade tightens | Cover withdrawn broadly | Transits fall well below 100/week | The Goldman scenario: $120+ becomes the live question |
Live Chart: Brent Crude
Investor Implications
Equities. The equity expressions of this story sort by their relationship to the premium. Tanker owners with vessels willing to transit are collecting record freight rates; integrated majors benefit from the crude price while absorbing logistics costs; refiners dependent on Gulf barrels face margin compression that widens with every week of disruption. Airlines and shipping-intensive consumer businesses carry the fuel cost with the least pricing power. Investors may wish to note that insurance itself is a live exposure: Lloyd’s market participants and specialty war-risk underwriters are writing this risk at forty times last month’s rates, which is either the trade of the year or the claim of the year, and the distinction will be decided by events no model prices well.
Fixed income. The oil-to-rates channel is the one that matters for duration: a sustained energy shock keeps hike risk alive at the Fed and the ECB simultaneously, as this month’s pricing has shown, and it does so while damaging growth, the classic configuration in which bonds fail to hedge equities. Credit investors might separately note that credit markets are entering this from the tightest spreads in twenty years, leaving little compensation for an energy-driven growth scare.
Cross-asset. The cleanest monitors of escalation are physical, not financial: weekly transit counts, war-risk quotes, and freight rates lead the futures curve at every turn of this conflict. Positioning for either direction is best informed by those series. Gold’s muted role this cycle, after its quiet bear market, has left crude itself as the market’s principal war hedge, which concentrates flows and exaggerates both directions of every headline.
What to Watch
- Weekly: Hormuz transit counts and war-risk quotes; a premium retreating below 2 per cent of hull value would be the first hard evidence of de-escalation, ahead of any diplomatic signal.
- Early August: OPEC+ output decisions for August loadings; any move to activate spare capacity outside the Gulf route would cap the crude move even with the strait constrained.
- Through Q3: the Goldman scenario’s test: whether the blockade economics persist long enough to force the $120 question, or whether premium decay repeats the pattern of every prior escalation this year.
- 10 September: the ECB’s projection meeting, where the summer’s energy prices become a rate decision; the Fed’s parallel debate runs on the same fuel.
Conclusion
The July escalation’s most important price is not the one on the terminal screens. Brent at $92 tells a story of a market still betting on reversion; insurance at 5 per cent of hull value tells a story of underwriters who have stopped extrapolating and started counting missiles. The strait is open by international law, closed by actuarial arithmetic, and the difference between those two states is being settled week by week in premium quotes that most market participants never see. Watching this conflict through the futures curve alone is watching the shadow rather than the object. The object, for now, is a market of a few dozen underwriters deciding, cargo by cargo, how much of the world’s oil gets to move, and at what price the moving stops making sense.
Sources: InvestorIdeas, the 1,900 per cent insurance move; TFTC, Hormuz war-risk premiums surge; Bitcoin.com News, Brent near $92 and falling tanker traffic; Foreign Policy, why spikes are more likely than assumed; CNBC, supertanker rates and war cover withdrawal; TradingView, Brent.
Related Reading: The strikes that broke the truce are covered in three tankers and the end of the US-Iran calm, and Washington’s short-lived attempt to tax the waterway in the Hormuz toll that lasted a day. How the oil shock reaches monetary policy is traced in the ECB’s hawkish hold and the Fed’s September hike debate. For the fundamentals, start with why the world has two oil prices, and how war-risk insurance moves oil markets. The trade-policy shock that followed is covered in the US forced labour tariffs. The property-market consequences are examined in UK property investment under PM Burnham. For the other side of the same trade, see how private capital priced twenty years of the corridor in the $16 billion Kuwait pipeline deal. The blockade going indefinite and the attacks on ADNOC shipping are analysed in the Iran naval blockade goes indefinite. The sanctions package that followed, and the oil market’s refusal to react to it, is covered in the economic D-Day announcement. For the latest, see Strait of Hormuz oil flows hit a wartime record as Brent neared $95.

Leave a Reply