

Khan Capitals | July 2026
Key Takeaways
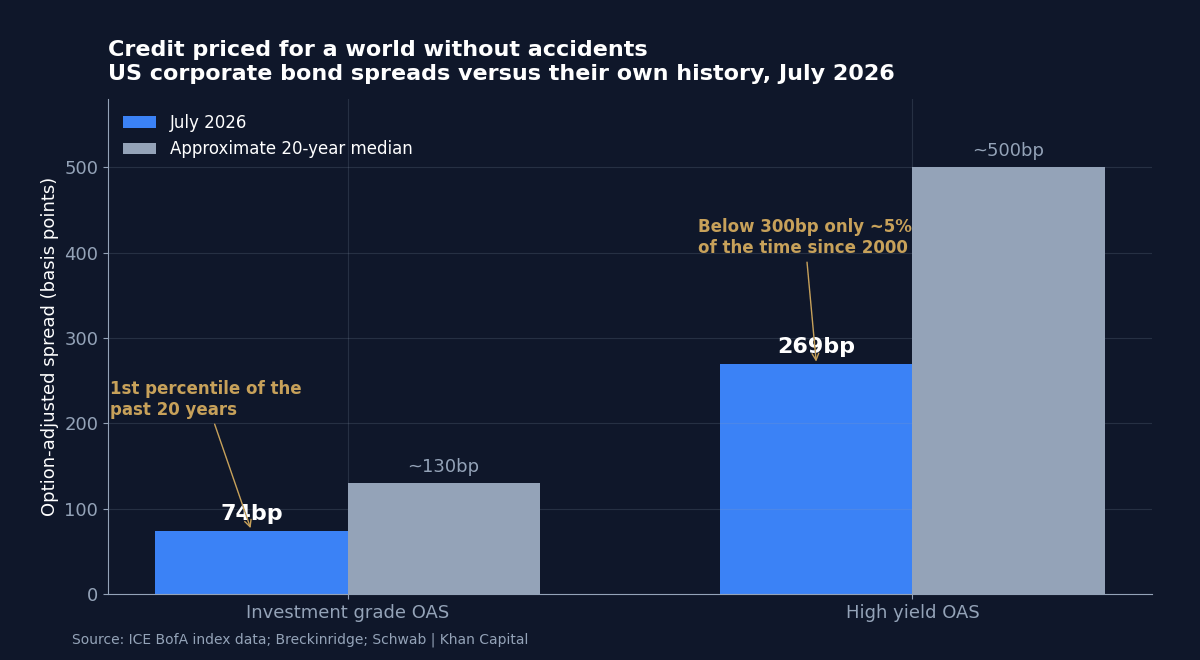
- US investment grade credit spreads have compressed to roughly 74 basis points, the first percentile of the past twenty years, after tightening a further 14 basis points as risk appetite recovered, according to Breckinridge’s Q3 outlook.
- High yield is telling the same story: spreads near 269 basis points sit below the 300 level that has been visited only about 5 per cent of the time since 2000, territory last regularly inhabited in the mid-1990s.
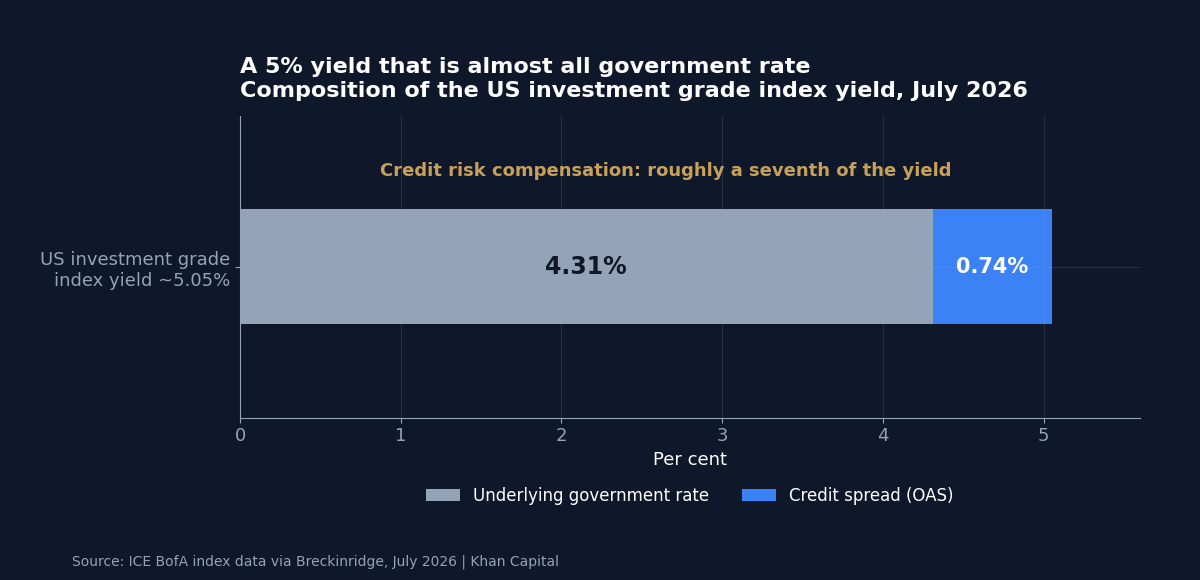
- The engine is yield, not spread. With all-in investment grade yields above 5 per cent, insurers and pension funds are buying income at levels that de-risk liabilities, largely indifferent to the fact that credit compensation is the thinnest slice of that yield in two decades.
- The context makes the pricing remarkable: spreads at generational tights coexist with an oil war, live rate-hike debates at the Fed and ECB, a semiconductor bear market, and the widest sector dispersion in years beneath the index surface.
- At 74 basis points, credit is priced for a world without accidents. The asymmetry is structural: spreads can tighten a few basis points further, and can widen by hundreds; the prudent response is quality migration rather than exit, and most managers are saying exactly that.
The Most Confident Market in the World
Somewhere between the missiles in the Strait of Hormuz and the rate-hike debates in Washington and Frankfurt, the credit spreads record tights story has become the quietest extreme in global markets. The extra yield investors demand for lending to America’s investment grade corporations over the government sits near 74 basis points, a level in the first percentile of the past twenty years. High yield spreads near 269 basis points have compressed below 300, a threshold crossed only about 5 per cent of the time this century. By the price of default risk, the corporate bond market is more relaxed than it has been in a generation, in a summer that offers an unusually rich menu of reasons not to be.
Extremes in credit deserve attention for a structural reason: credit is the asset class with the least upside to being right and the most downside to being wrong. An investment grade spread of 74 basis points can, at best, grind a little tighter. Against that stands the full distribution of things that widen spreads by hundreds: recessions, funding accidents, an energy shock hardening into stagflation. Buying credit at the first percentile is selling insurance at the lowest premium in twenty years, into a news cycle that includes a war on the world’s most important oil artery.
The Yield Illusion Doing the Buying
The compression has a mechanical explanation, and it starts with the number that headlines never lead with: the all-in yield. An investment grade index yielding just above 5 per cent looks, to an income buyer, like the best entry in fifteen years, and by the standards of the 2010s it is. But decompose that yield and the credit component nearly vanishes: roughly 4.3 percentage points is simply the government rate, the price of money itself in a world where the Fed is debating a hike, and only 0.74 of a point is compensation for lending to a corporation rather than the Treasury.
For the marginal buyer, that decomposition is irrelevant. Insurance companies and pension funds buy bonds to match liabilities discounted at all-in yields; a 5 per cent handle de-risks a scheme regardless of how the yield splits between rate and spread. Demand from that community has absorbed heavy issuance all year without indigestion, and every episode of weakness has been met with inflows chasing the income. The result is a market where the headline yield does the buying and the spread, the actual price of credit risk, is set residually by flows that are not primarily about credit risk at all.
What the Tights Are Genuinely Standing On
It would be too easy to declare the market wrong. The fundamentals beneath the spread are real. Corporate balance sheets termed out debt at the low rates of 2020-21 and have run conservative refinancing calendars since; interest coverage, while off its best, remains healthy across most of the investment grade universe. Earnings outside the contested corners of technology have been solid, as the banks’ record quarter demonstrated. Defaults have stayed contained, and the ratings mix of the high yield index is higher-quality than in past cycles, with more BB and less CCC than the index carried into 2008 or 2020.
The tights also stand on a genuine technical: net supply of spread product has lagged the wall of income-seeking demand. Heavy gross issuance has been met by even heavier appetite, and the growth of private credit has diverted a share of the riskiest borrowing away from public indices altogether, mechanically upgrading what remains. Some of the compression, in other words, reflects a market whose composition has improved. The question is how much; a first-percentile spread requires believing nearly all of it does.
| Measure | July 2026 | Historical context |
|---|---|---|
| IG spread (OAS) | ~74bp | 1st percentile of past 20 years; recently 14bp tighter |
| HY spread (OAS) | ~269bp | Below 300bp seen ~5% of the time since 2000 |
| IG all-in yield | >5% | Well above the 2010s average; the demand engine |
| Spread share of IG yield | ~15% | Thinnest credit compensation in two decades |
| Sector dispersion | Widest in years | Supply shocks hitting sectors unevenly |
| Comparable era | Mid-1990s | Last sustained visit to these levels |
The Dispersion Beneath the Calm
The index-level serenity conceals an unusually opinionated market underneath. Sector dispersion is running at its widest in years, because this cycle’s shocks are supply-side and land unevenly: energy-exposed sectors trade the war, technology trades the AI capex question, and utilities trade the data centre power build-out. Wellington’s mid-year work describes the configuration precisely as “tighter spreads, wider dispersion”, a market that has stopped pricing macro credit risk while pricing micro differences aggressively.
That combination is historically late-cycle. It is what credit looks like when the index buyer has surrendered to the income flow while the specialist is quietly sorting winners from losers ahead of a turn. It is also, more optimistically, what a market looks like when supply shocks genuinely are idiosyncratic and the system genuinely is resilient. Both readings fit the data; only the next accident distinguishes them, which is why the margin for error embedded in 74 basis points is the single number that matters.
The Index Is No Longer the Whole Market
There is one further reason to treat the public spread with caution as a risk barometer: it no longer measures what it measured in past cycles. Fifteen years of private credit growth has moved a large share of the economy’s riskiest lending off public indices entirely. The leveraged borrower who would once have issued a CCC bond now borrows from a direct lending fund; the aggressive acquisition financing that would once have widened the high yield index now lives in unlisted vehicles that publish quarterly marks rather than daily prices. Public spread indices have been, in effect, survivorship-biased in real time, upgraded by the departure of their weakest members.
The implication cuts both ways. It means part of the compression is compositional and genuine, as noted above. But it also means the public spread can stay serene while stress builds where daily prices do not reach, and this year has already supplied the example: roughly $14 billion sits behind private credit redemption gates while the public high yield index trades at 269 basis points. In 1998 the accident came from a hedge fund no index tracked; the structural rhyme is uncomfortable enough that the tightness of the visible market should be read, at least partly, as a statement about where the risk has gone rather than whether it exists.
What 74 Basis Points Buys You If History Rhymes
The mid-1990s, the last sustained residence at these levels, are the bulls’ favourite precedent, and it is worth taking seriously: spreads stayed tight for years, the economy grew, and credit investors earned their carry without incident until 1998. The precedent’s second half is the caution. When the widening came, it came from an off-index shock, a Russian default and a levered fund, and it repriced everything within weeks. Tight spreads did not cause the accident; they simply guaranteed that nobody was paid for it in advance.
The carry mathematics deserve one more sentence of respect before the caution: at these yields, an investment grade portfolio earns its coupon through a surprising amount of widening, and investors who sat out the 2010s waiting for wider spreads mostly just forwent a decade of income. Tight is not the same as wrong, and the income case is the strongest it has been in fifteen years even if the credit case is the weakest.
The 2026 equivalents of an off-index accident write themselves. An energy shock that hardens the Hormuz premium into a stagflationary tax. A hiking cycle on both sides of the Atlantic meeting an economy growing below 1 per cent in Europe. A funding accident in the levered corners of the AI build-out, where redemption gates have already appeared. None of these is a forecast; all of them are visible, which is the point. The market is not pricing the invisible tail; it is declining to price the visible one.
Live Chart: High Yield Credit (HYG)
Investor Implications
Fixed income. The near-universal manager response to this configuration is quality migration, and the logic is sound: moving up in quality currently costs very little carry, because compressed spreads mean the yield give-up from BBB to A, or from B to BB, is historically small. Investors may wish to consider that the trade of the moment is not exiting credit, which abandons a 5 per cent all-in yield that still de-risks liabilities, but repositioning within it: shortening spread duration, favouring sectors on the right side of the supply shocks, and treating the thinnest-premium corners of high yield as return-free risk. Dispersion this wide also restores the case for active selection over index exposure precisely when index yields make passive credit look easiest.
Equities. Credit at generational tights is, mechanically, an equity support: refinancing is cheap, buybacks are fundable, and the discount rate on corporate cash flows is contained. It is also a warning about correlation. The last two decades’ equity drawdowns that mattered all came with spread widening attached, and at the first percentile there is no cushion for that transition; a credit repricing would arrive in equity multiples almost immediately. Equity investors holding richly valued indices are, whether they intend it or not, short the same insurance the credit market is selling.
Cross-asset. Spreads this tight convert credit from a return asset into a signalling asset: at 74 basis points, the information in any widening is worth more than the carry in any further tightening. A sustained move through roughly 100 basis points on the IG index would be the cleanest single indicator that the regime has turned, and it is worth privileging over equity volatility measures, which have been distorted all year by the mechanics of the oil headlines.
Conclusion
Every market era has one price that later generations struggle to explain, and July 2026’s candidate is not to be found in equities or oil but in the 74 basis points separating corporate America from the Treasury curve. The explanation, in fairness, is rational at every step: real yields did the buying, real balance sheets earned the confidence, and real supply technicals did the compressing. But rational steps can still assemble an irrational destination, and a market offering its thinnest credit compensation in twenty years, in a summer of war premiums and hike debates, has left itself no room to be surprised. Credit at these levels is not predicting disaster, and neither is this analysis. It is simply no longer being paid to entertain the possibility, and that, more than any forecast, is what the first percentile means.
Frequently Asked Questions
What are credit spreads and why do they matter?
A credit spread is the extra yield a corporate borrower pays above the government rate for the same maturity, and it is the market’s price for default risk. Spreads are watched as a barometer of financial conditions: tight spreads signal confidence and cheap corporate funding, while rapid widening has preceded or accompanied nearly every major downturn of the past thirty years.
How tight are credit spreads in July 2026?
US investment grade spreads sit near 74 basis points, a level in the first percentile of the past twenty years, and high yield spreads near 269 basis points are below the 300 mark that has occurred only about 5 per cent of the time since 2000. Comparable levels were last sustained in the mid-1990s.
Why are investors still buying corporate bonds at record tight spreads?
Because the all-in yield, above 5 per cent for investment grade, is attractive to income buyers such as insurers and pension funds who discount liabilities at total yields rather than spreads. Strong corporate balance sheets, contained defaults and heavy demand relative to net supply have supported the market, even though the credit-risk component of the yield is historically thin.
What would cause credit spreads to widen from here?
The visible candidates include a sustained energy shock from the Hormuz disruption feeding into growth, further central bank tightening into weak economies, or a funding accident in leveraged corners of the market such as parts of private credit. At current levels spreads offer little cushion against any of these, which is why many managers are moving up in quality while staying invested.
Sources: Breckinridge, Q3 2026 corporate bond market outlook; Charles Schwab, 2026 corporate credit outlook; Wellington Management, tighter spreads, wider dispersion; PineBridge, 2026 investment grade outlook; Forbes, what tight spreads mean for fixed income investors; TradingView, HYG.
Related Reading: The rate debates that set the government leg of the yield are covered in the Fed’s September hike pricing and the ECB’s hawkish hold. The leveraged corner where cracks have already shown is examined in the $14 billion redemption gate, and the open-market test of AI credit risk in the $35 billion deal that started trading. For the fundamentals, start with credit spreads, the fear gauge for lending, and what a bond actually is.

Leave a Reply