

Khan Capitals | August 2026
Key Takeaways
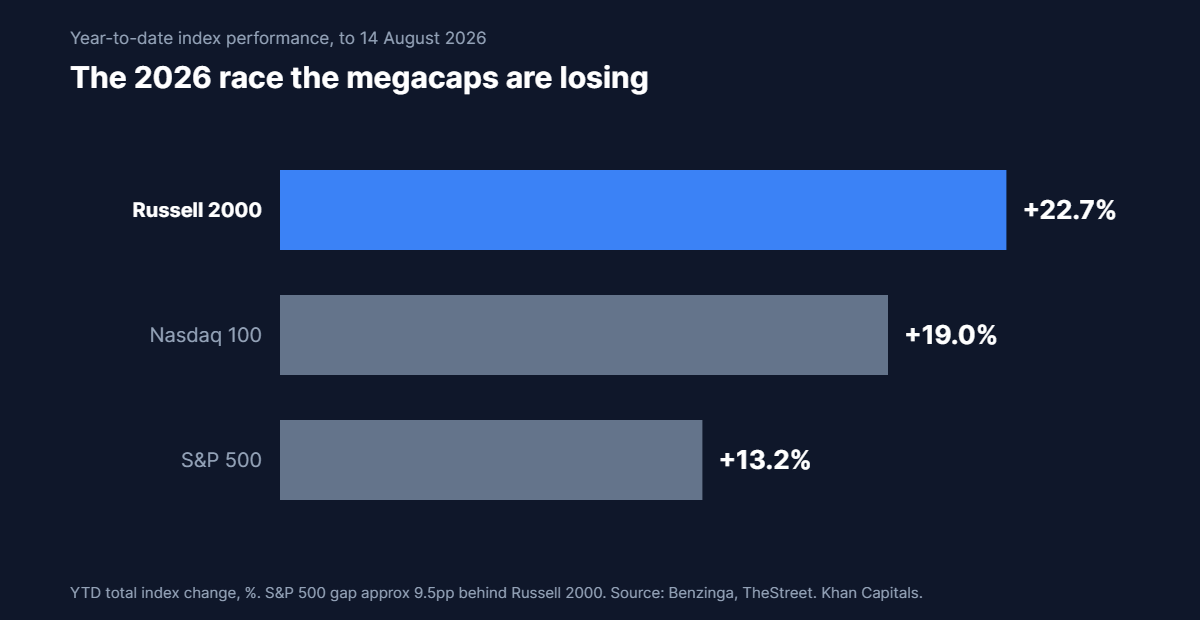
- The small-cap rotation reached a milestone week: the Russell 2000 closed Friday at a record 3,068, its 27th record close of 2026, and is up 22.7 per cent year to date, roughly 9.5 percentage points ahead of the S&P 500.
- The market sold two of the strongest AI prints of the season: Applied Materials reported record revenue, earnings and margins and fell around 5 per cent after hours; Cisco guided fiscal 2027 revenue roughly $4 billion above consensus and fell 4 per cent.
- The divergence is positioning, not fundamentals: after a 200 per cent rally in Applied Materials and a decade-best run in networking, beats that would once have gapped stocks higher now meet owners looking for a reason to trim.
- Rate expectations are doing the heavy lifting: the collapse in September hike odds after tame July inflation disproportionately helps smaller companies, which carry more floating-rate debt and domestic revenue than the megacaps.
- Breadth is the story the indices hide: the S&P 500 added just 0.4 per cent on the week and the Dow fell 0.6 per cent, yet small caps outran the Nasdaq 100 for the year; the equal-weight market is finally participating in a rally the megacaps led alone for two years.
A Record Nobody Was Positioned For
The small-cap rotation of 2026 produced its defining week in the five sessions to 14 August. The Russell 2000 set another all-time high on Friday, closing at 3,068 for its 27th record close of the year, while the two most closely watched AI infrastructure results of the week, from Applied Materials and Cisco Systems, were both sold despite comfortably beating expectations. One index that spent two years being dismissed as un-investable is making records; the trade that made the records is being graded on a curve it can no longer beat.
The scale of the reversal deserves numbers. The Russell 2000 is up 22.7 per cent year to date, ahead of the Nasdaq 100’s 19 per cent and roughly 9.5 percentage points clear of the S&P 500. Less than a month after small caps confirmed a textbook correction during the worst of the US-Iran conflict, the iShares Russell 2000 ETF rallied roughly 8.6 per cent in two weeks, against a 1.6 per cent gain for the S&P 500. That is not a squeeze; it is a re-rating happening faster than most allocators can rewrite their models.
The Beats the Market Refused to Pay For
Thursday evening supplied the week’s cleanest experiment in market psychology. Applied Materials, the largest US semiconductor equipment maker and a company whose shares had rallied roughly 200 per cent over the preceding year, reported fiscal third-quarter revenue of $9.12 billion and earnings of $3.50 per share, beating consensus of $8.99 billion and $3.40. Revenue, earnings, gross margin and operating margin were all records. Guidance was hardly timid: fourth-quarter revenue of $10.25 billion at the midpoint and earnings of $4.02 per share, both above the Street. The stock fell more than 5 per cent in extended trading.
A day earlier, Cisco Systems had run the same experiment with the same result. The networking company beat on its fiscal fourth quarter and guided full-year 2027 revenue to $72.2 to $73.4 billion, as much as $4.7 billion above the $68.69 billion consensus, with earnings guidance of $5.05 to $5.11 against an expected $4.80. AI infrastructure orders have turned a mature enterprise supplier into a growth story. The shares fell 4.1 per cent after hours anyway.
Two large beats, two strong guides, two selloffs. The pattern echoes the split we documented when Palantir’s 93 per cent growth quarter was rewarded with a 29.5 per cent surge while hardware names languished, and it extends the repricing that began with the semiconductor bear market in July, when the Philadelphia Semiconductor Index fell 20 per cent in three weeks against record earnings. The market is not questioning whether the AI build-out is real. It is questioning what it has already paid for the companies supplying it.

What the Small-Cap Rotation Is Actually Buying
If the selling in AI bellwethers is about exhausted expectations, the buying in small caps is about expectations that were never set. Small caps entered 2026 trading at a discount to large caps that analysts put at roughly 34 per cent on forward earnings, the residue of two years in which higher rates punished smaller balance sheets and the index went nowhere while megacap technology compounded. Health care and financials together make up close to 40 per cent of the Russell 2000; neither sector needed an AI narrative to be cheap.
What changed is the rate path. As we detailed in the collapse of September hike odds, tame July inflation landing days after a negative payrolls print halved the probability of a September rate rise in a little over a week. Smaller companies carry a structurally higher share of floating-rate and near-maturity debt than the megacaps, many of which are net cash. Every basis point that comes out of the expected policy path is worth more to the Russell 2000 than to the S&P 500, and the market has spent two weeks repricing exactly that arithmetic.
The revenue mix points the same way. Russell 2000 constituents source the large majority of their sales domestically, which mutes both the tariff exposure that has complicated multinational guidance and the currency translation risk that a volatile dollar imposes on the megacaps. In a summer when trade policy has been a recurring source of headline risk, domestic revenue has quietly become a scarcity premium rather than a provincial discount.
Positioning amplifies all of it. Two years of megacap leadership left professional allocators structurally underweight smaller companies, benchmarked against indices the Russell does not resemble and burned by every previous false dawn in the size trade. A rally that starts against that positioning feeds on its own success: each new record forces another underweight to cover, and the covering is itself the flow that sets the next record. It is the same reflexivity that powered the megacap era, pointed at the other end of the market, and it is why the move has been faster than the fundamental news alone would justify.
The Week’s Scoreboard
The headline indices flattered neither story. The S&P 500 set a record above 7,800 intraday on Thursday at 7,798.99 on the close, then slipped 0.2 per cent on Friday to 7,785.76, still good for a third consecutive weekly advance of 0.4 per cent. The Nasdaq Composite added 0.1 per cent on the week to 26,729.16 and the Dow fell 0.6 per cent to 53,732.41. Beneath the surface, energy led the sectors with the Energy Select Sector SPDR up 4.6 per cent on the week’s Iran escalation, while rate-sensitive real estate and utilities lagged alongside technology.
| Result | Reported | Consensus | Guidance vs Street | Share reaction |
|---|---|---|---|---|
| Applied Materials Q3 FY26 | $9.12bn rev, $3.50 EPS (records) | $8.99bn, $3.40 | Q4 $10.25bn, $4.02 EPS, above | -5.2% after hours |
| Cisco Q4 FY26 | Beat on revenue and EPS | FY27 rev est $68.69bn | FY27 $72.2-73.4bn, EPS $5.05-5.11 vs $4.80 | -4.1% after hours |
| Russell 2000 | 3,068 close, 27th record of 2026 | n/a | n/a | +22.7% YTD |
A Grading Curve That Punishes Ownership
There is a mechanical explanation for beats being sold, and it matters because it is diagnostic rather than bearish. When a stock has rallied 200 per cent into a print, the marginal buyer has already bought. The result confirms the thesis of everyone who owns it and persuades no one new; the only incremental flow available is profit-taking. That is how the market graded Big Tech’s capex line by line two weeks earlier, when Microsoft and Amazon were paid for discipline while Meta was fined for ambition, and it is how a record quarter from the most important equipment company in the AI supply chain can be worth 5 per cent less the moment it is published.
The history of concentrated bull markets suggests this phase is common and unstable in both directions. Narrow leadership tends to broaden late in a cycle as valuation gaps become untenable, and the broadening itself is usually read, correctly or not, as a health signal. The awkward precedent is that some of the sharpest breadth improvements on record arrived in the final innings of a trend, when the last sceptics capitulated into the laggards. Breadth is evidence the rally has legs; it is not evidence the legs are fresh.
Scenarios for the Rotation
| Scenario | Conditions | Likely expression |
|---|---|---|
| Bull: durable broadening | Inflation stays tame, no September hike, growth data stabilises | Small caps and equal-weight indices extend leadership; megacap AI consolidates rather than corrects |
| Base: two-tier chop | Mixed data, Fed on hold, AI results strong but sold | Russell holds gains, index-level progress slows as leadership rotates week to week |
| Bear: growth scare | Consumer weakness deepens after July’s retail sales fall, payrolls stay negative | Small caps give back leadership fastest; quality megacaps reclaim defensive bid |
The bear leg of that table is not hypothetical. The same Friday that capped the Russell’s record week brought a 0.6 per cent fall in July retail sales, the largest monthly drop in more than a year, days after the first payrolls contraction in 53 months. A rotation built on rate relief has to survive the reason rates are being repriced: the economy is slowing. Small caps are the highest-beta expression of the domestic economy, in both directions.
The Chart the Rotation Trades On
Investor Implications
Equities. The week’s message is about entry points, not exits. Record results from Applied Materials and Cisco confirm the AI infrastructure cycle remains intact; the selloffs confirm that owning it at current multiples requires patience through digestion phases. The small-cap leg carries the opposite profile: cheaper starting valuations and rate sensitivity, but maximum exposure to a domestic economy that just printed falling retail sales and shrinking payrolls. Positioning that treats the rotation as a permanent regime change, rather than a rate-driven convergence trade, embeds a strong assumption about a soft landing that the data has not yet earned.
Fixed income. The rotation is downstream of the rates market. The 10-year Treasury yield finished the week at 4.68 per cent with long yields drifting higher even as policy expectations softened, a combination that says the bond market accepts a slower Fed but worries about what easier policy means for inflation. If that long-end concern hardens, the valuation maths supporting both small caps and richly priced AI names weakens together, as we explored in the 74 basis point question.
Cross-asset. A broadening equity market with softening consumer data and firm long yields is a late-cycle configuration, not an early-cycle one. Diversification across the size spectrum is currently being rewarded, but the same catalyst, rate cuts arriving because growth is deteriorating, would eventually punish it. The distinction between cuts the market wants and cuts the market fears has defined every easing cycle; watching which one this becomes is the single most important cross-asset question into September.
What to Watch
- 20 August: FOMC minutes from the July meeting, the first full account of how deep the triple dissent’s hawkish argument ran.
- 27-29 August: the Jackson Hole symposium, the natural stage for guidance ahead of the September meeting.
- 28 August: the BLS benchmark payrolls revision, which could redraw the labour market picture the rotation is trading on.
- 4 September: August payrolls; a second consecutive negative print would move the story from rotation to growth scare.
Conclusion
Markets spent two years paying any price for exposure to the AI build-out and calling everything else dead money. This week they paid nothing for two of the best AI results of the season and set records in the index that owns none of it. The reconciliation is less mysterious than it looks: the AI trade is being asked to grow into what it already costs, while small caps are being repriced for a rate path that finally favours them. Both things can be true, and neither is a verdict. The verdict arrives with the data: if the consumer stabilises, the broadening is the healthiest development of the year; if July’s retail sales and payrolls prints were the start of something, the rotation will have been the market’s last optimistic trade before the growth question got serious.
Frequently Asked Questions
What is the small-cap rotation in 2026?
The small-cap rotation refers to the outperformance of smaller US companies, tracked by the Russell 2000, against megacap-dominated indices in 2026. The Russell 2000 is up 22.7 per cent year to date with 27 record closes, roughly 9.5 percentage points ahead of the S&P 500, driven by falling rate expectations, a wide starting valuation discount and a shift of flows away from richly priced AI leaders.
Why did Applied Materials and Cisco fall after beating estimates?
Both stocks had rallied hard into their results, Applied Materials by roughly 200 per cent over the prior year. When expectations and positioning are that elevated, a beat confirms what holders already believed and attracts few new buyers, so profit-taking dominates. The selloffs reflected exhausted expectations rather than weak fundamentals; both companies beat estimates and raised guidance.
Do small caps outperform when interest rates fall?
Historically, smaller companies tend to benefit more than large caps when rate expectations fall, because they carry a higher share of floating-rate and near-term debt and are more sensitive to domestic financing conditions. The relationship is not mechanical: if rates fall because growth is deteriorating sharply, small caps’ greater economic sensitivity can outweigh the financing benefit, which is the central risk to the current rotation.
Sources: Benzinga, TheStreet, Investing.com, Applied Materials Investor Relations, Cisco Investor Relations, CNBC, Yahoo Finance.
Related Reading: The repricing of the AI supply chain began with the semiconductor bear market that unwound a 105 per cent rally, and the split between hardware scepticism and software belief was clearest in Palantir’s 93 per cent quarter. The rate repricing driving the rotation is covered in the collapse of September hike odds, the capex arithmetic behind the AI trade in the week the market graded AI capex line by line, and the credit market’s version of priced-for-perfection in credit spreads at record tights. For the fundamentals, start with how earnings season moves stocks and what the major indices actually measure. The rotation’s quiet beginnings were charted in May in the quiet Russell 2000 leadership. The same reflex, a whole category repriced on one qualitative headline, drove the mRNA cancer vaccine breakthrough. Nvidia’s own verdict arrived in the $96 billion quarter the market finally bought. The rotation’s sequel arrived with September’s AI safety selloff.

Leave a Reply