

Khan Capitals | August 2026
Key Takeaways
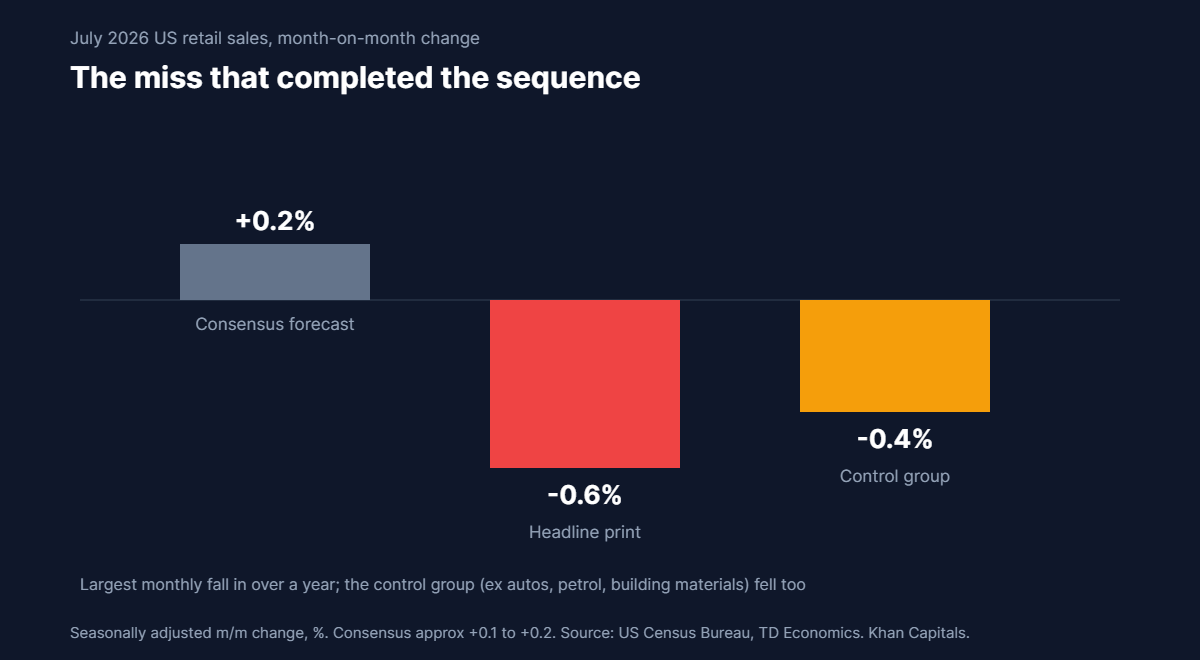
- July retail sales fell 0.6 per cent to $763.6 billion, the largest monthly drop in more than a year, against consensus expectations for a modest gain of around 0.1 to 0.2 per cent, according to the Census Bureau’s advance estimate.
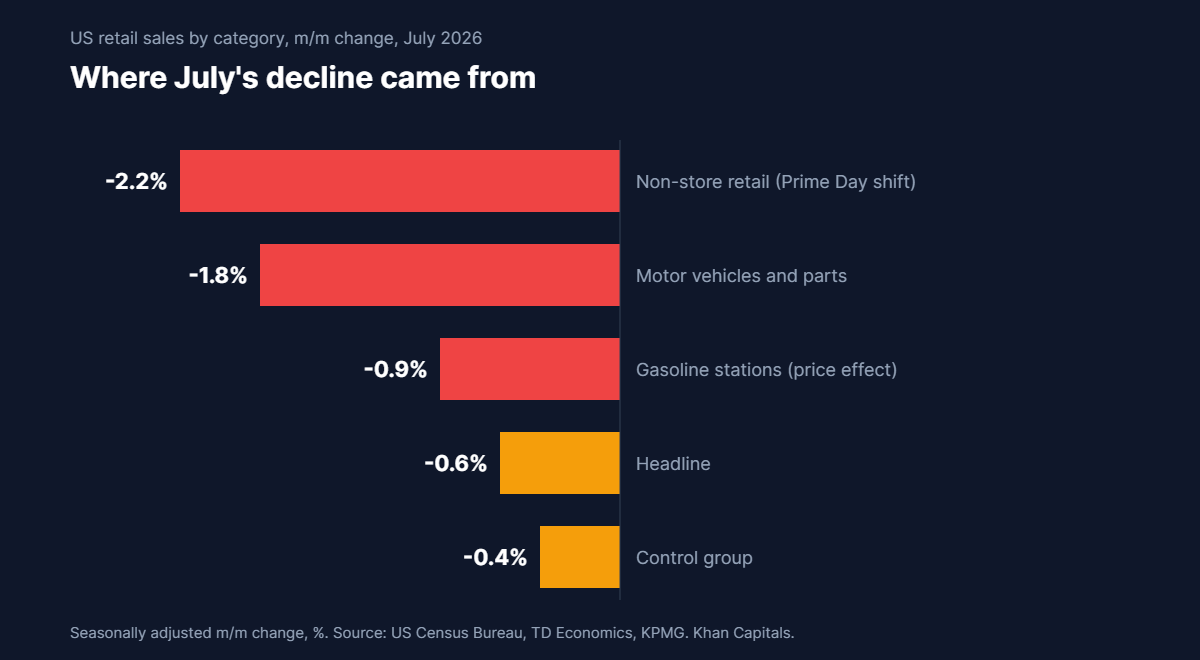
- The weakness was broad but not uniform: autos fell 1.8 per cent after strong prior months, petrol stations 0.9 per cent on lower pump prices, and non-store retail 2.2 per cent, partly because Amazon’s Prime Day shifted into June this year.
- The control group, the cleaner read, fell 0.4 per cent: the measure that feeds GDP, excluding autos, petrol, building materials and food services, declined too, so the miss cannot be dismissed as noise from volatile categories.
- The consumer has joined the labour market’s story: the drop lands days after July payrolls fell 23,000, the first contraction in 53 months, completing a demand-side picture the Federal Reserve’s hawks will find harder to argue past.
- Annual comparisons still flatter: sales remain 5.0 per cent above July 2025 and the May-July window is up 6.3 per cent year on year, a reminder that the level of spending is high even as the momentum stalls.
Part of: The Fed’s Regime Change – Khan Capital’s hub on the Fed’s 2026 regime change.
The Print That Completed the Picture
The July retail sales report, released on Friday morning, delivered the miss the labour market had been foreshadowing for a week. Retail and food services sales fell 0.6 per cent on the month to $763.6 billion, the sharpest monthly decline in over a year, where forecasters had pencilled in a small gain. Coming five days after the first negative payrolls print in 53 months and two days after the tame inflation data that halved the odds of a September rate hike, the release completes a sequence: fewer jobs, cooler prices, and now less spending. Individually, each print has an excuse. Together, they describe an economy losing speed.
Markets treated the report as confirmation rather than shock. The S&P 500 slipped 0.2 per cent from Thursday’s record and still closed out a third consecutive weekly gain; the 10-year Treasury yield ended the week at 4.68 per cent. The muted reaction is itself the interesting fact: a consumer wobble that would have rattled the tape in June now slots neatly into a narrative the rates market has already built, and, as we explore below, the composition of the report gives both optimists and pessimists something defensible to hold.
Inside the July Retail Sales Breakdown
| Category | July change (m/m) | Reading |
|---|---|---|
| Headline retail and food services | -0.6% | Largest monthly fall in over a year; consensus expected a small gain |
| Control group (ex autos, petrol, building materials, food services) | -0.4% | The GDP input declined; weakness is not just volatile categories |
| Motor vehicles and parts | -1.8% | Payback after robust gains in prior months |
| Gasoline stations | -0.9% | Mostly price: pump prices fell in July |
| Non-store retailers | -2.2% | Distorted by Prime Day moving to June from July |
The composition gives the report its texture. The auto decline follows genuinely strong months and reads as payback. The petrol figure is largely arithmetic: these are nominal sales, and cheaper fuel mechanically shrinks them, which is the benign kind of decline. The 2.2 per cent slide in non-store retail carries the largest asterisk, because Amazon moved its Prime Day event into June this year, pulling a slug of online spending forward and leaving July’s seasonally adjusted comparison facing a hole the adjustment factors were never designed for. Calendar quirks like this pass straight through the seasonal filters, a mechanism we unpack in our explainer on seasonal adjustment linked below.
Strip the asterisks out, though, and the control group still fell 0.4 per cent. That is the measure that maps into GDP arithmetic, deliberately excluding autos, petrol and building materials to expose the underlying trend. It does not distinguish between a consumer who cannot spend and one who has decided to wait, but it establishes that July’s weakness was real and reached beyond the categories with excuses.
A Demand-Side Ledger the Hawks Must Answer
| Indicator | Latest print | Signal |
|---|---|---|
| Nonfarm payrolls (July) | -23,000 | First contraction in 53 months |
| Retail sales (July) | -0.6% m/m | Largest fall in over a year |
| Retail control group (July) | -0.4% m/m | Core spending declined |
| CPI (July) | In line, energy-flattered | Halved September hike odds |
| PPI final demand (July) | 0.0% m/m, +4.7% y/y | Pipeline pressure cooling monthly, elevated annually |
Recall the institutional backdrop. The July FOMC meeting produced the first unified triple dissent for a hike since 2016, a committee whose centre held policy steady while three members argued inflation warranted more restriction. That argument leaned on a labour market described as solid and a consumer described as resilient. In the three weeks since, the labour market printed its first contraction in four and a half years and the consumer printed the weakest month in over a year. The hawks’ case has not been demolished, PPI’s 4.7 per cent annual rate is a genuine counterweight, but its two load-bearing assumptions have cracked in the same fortnight.
High Level, Falling Momentum
The strongest argument against reading July as the start of a retrenchment is the level of spending. Sales remain 5.0 per cent higher than a year earlier, and the May-to-July window is running 6.3 per cent above the same period of 2025; some of that is price, but by no measure is the American consumer spending like a recession has arrived. Households are still employed at high levels, and the wealth effects of an equity market at records, explored in this week’s rotation analysis, cut in spending’s favour.
What the aggregate conceals is distribution, and distribution is where the pessimists’ case lives. Equity wealth concentrates among households whose spending was never constrained; the households most exposed to a softening jobs market hold little of it. If July’s pullback is concentrated among lower- and middle-income consumers reacting to a weaker labour market, the record-setting stock market is not a cushion for the spending that is actually at risk; it is a distraction from it. The trading-down behaviour that discount retailers reported through the spring points that way, and it is the pattern their upcoming results can now confirm or refute.
The counter-argument is directional. Levels describe where the economy has been; momentum describes where it is going. A consumer that is 5 per cent up on last year but shrinking month on month is a consumer decelerating, and the deceleration is now corroborated across jobs, spending and the price data that responds to both. The historical pattern that should concentrate minds is that consumer retrenchments rarely announce themselves cleanly: they appear first as a string of individually excusable misses, each with a Prime Day or a petrol price to blame, until the string is long enough to name.
The Retailer Earnings Test
Conveniently for anyone seeking corroboration, the report lands at the front of retailer earnings season. Over the coming fortnight the largest US retailers report second-quarter results and, more importantly, comment on how the quarter ended and how August has begun. Their commentary answers the question the Census data cannot: whether July’s weakness was volume or price, discretionary or broad, and whether it persisted into the new month. Management teams have every incentive to blame weather, calendars and comparisons; the numbers that resist spin are traffic, units per transaction and inventory positioning. Retailers building inventory into the autumn believe in their customer; retailers cutting orders do not, and their suppliers’ guidance will say so before any official statistic does.
The stakes are asymmetric because of where expectations sit. Consumer discretionary stocks have participated fully in the market’s advance, and the small-cap complex that just set records is, in composition, a bet on domestic demand. Confirmation that the consumer merely paused would validate both; confirmation of a genuine downshift would find a market with very little weakness priced anywhere.
What History Says About Months Like July
Single bad retail months are common in expansions and mean little on their own; the informative cases are the ones with company. In 2015 and 2016, an industrial recession swept through American manufacturing while the consumer barely blinked, and the expansion survived because spending momentum never joined the downturn. In 2007, by contrast, retail weakness arrived after the labour market had already begun to soften, and the combination was the tell that the cycle was turning. The distinction is exactly the one July poses: a spending wobble in isolation is noise; a spending wobble that follows the first payrolls contraction in 53 months is a pattern demanding attention. That is why the next two retail sales prints carry more weight than usual, and why the August payrolls report on 4 September has become the most important data point of the quarter.
The Retail Tape
Investor Implications
Equities. Consumer discretionary earnings estimates now carry the burden of proof, and the next fortnight’s retailer results will be read as referenda on July’s data. The distinction that matters is between price-led weakness, cheaper petrol, calendar effects, and volume-led weakness; companies that confirm falling volumes will find no shelter in the index’s records. The small-cap complex, the market’s purest domestic-demand exposure, has the most to lose if the consumer keeps slowing, precisely because it has just re-rated on the rate relief that consumer weakness delivered.
Fixed income. The front end has already moved: September hike odds collapsed before this report and the retail miss entrenches the repricing. The open question sits at the long end, where the 10-year at 4.68 per cent reflects a market that accepts a slower Fed but has not decided whether slower growth or sticky pipeline inflation wins. A second month of falling control-group sales would push the balance toward duration; a rebound would leave the PPI’s 4.7 per cent annual rate as the print that ages best.
Cross-asset. The configuration to monitor is the one where equity records, softening demand and firm long yields coexist, because it rarely persists. Historically, one of the three gives way. The consumer data now argues the records are the vulnerable leg; the levels data argues the weakness is. Cash flows into defensive staples versus discretionary names, and the relative performance of domestic small caps against multinational large caps, will show which way professional money is voting well before the next official print.
What to Watch
- 20 August: FOMC minutes, for how the July committee weighed consumer resilience before the data turned.
- 27-29 August: Jackson Hole, the first opportunity for the Fed’s leadership to reframe policy around a slowing demand picture.
- 28 August: the BLS payroll benchmark revision and July PCE data, the Fed’s preferred inflation gauge, in the same week.
- 4 September: August payrolls, the print that decides whether July was an air pocket or an inflection.
Conclusion
July’s retail sales report is the kind that rewards neither camp with a verdict. The 0.6 per cent fall overstates the weakness, because petrol prices and a shifted Prime Day did some of the damage; the 5.0 per cent annual gain overstates the strength, because momentum, not level, is what turns cycles. What the report establishes beyond argument is sequence: the labour market, prices and spending are now all pointing the same direction for the first time in this expansion, and that direction is cooler. The Federal Reserve wanted demand to slow. The next three prints decide whether it got what it wanted or more than it asked for.
Sources: US Census Bureau, Census Advance Monthly Retail Trade Report, TD Economics, KPMG Economics, CNN Business, PBS News, Bureau of Labor Statistics.
Related Reading: The rates repricing this report entrenches is covered in the collapse of September hike odds, and the payrolls contraction that preceded it in the week the melt-up met a shrinking jobs market. The Fed’s internal battle is set out in the triple dissent, and the inflation print that started the sequence in the June CPI report. For the fundamentals, start with how to read the retail sales report and why one-off events fool seasonally adjusted data. The other consumer engine’s stall is covered in China’s July stall. The retailers answered this print in retail earnings week: tariff refunds and a Walmart warning. The stage all of this sets is examined in our preview of Warsh’s first Jackson Hole keynote. For a premium brand feeling that squeeze, see Lululemon’s guidance cut.

Leave a Reply