

Khan Capitals | August 2026
Key Takeaways
- The July consumer price index rose 0.1 per cent on the month and 3.4 per cent on the year, with core inflation at 0.2 per cent monthly and 2.5 per cent annually, according to the Bureau of Labor Statistics. Core is now at its lowest annual rate of this cycle.
- September rate hike odds have fallen by roughly half in eight sessions. Futures priced a 55 per cent chance of a hike on 6 August. By late morning on 12 August that had dropped to around 38 per cent, with the implied probability of a hold rising to 64 per cent.
- The jobs report did the damage; the inflation print merely declined to repair it. Payrolls fell 23,000 in July against expectations of an 85,000 gain, and revisions removed a further 103,000 jobs from May and June.
- Energy remains the awkward number. Headline energy prices fell 1.5 per cent on the month but are still 14.7 per cent higher than a year ago, and petrol is up 24.6 per cent. The disinflation is arithmetic as much as it is progress.
- Nothing is settled before 16 September. Two more employment reports and one more inflation print land before the committee votes, and three of its members dissented in favour of a hike only a fortnight ago.
Part of: The Fed’s Regime Change, Khan Capital’s hub on the Fed’s 2026 regime change.
Eight Days That Unwound a Quarter of Hawkishness
On 29 July the Federal Open Market Committee held the federal funds target range at 3.50 to 3.75 per cent, and three of its members refused to go along with it. Beth Hammack, Neel Kashkari and Lorie Logan each voted to raise rates a quarter point, the first time since September 2016 that three policymakers dissented in the same direction at the same meeting. The market read it exactly as it was meant to be read: a committee with a hawkish minority large enough to become a majority.
Thirteen days later, that reading has been dismantled by two data releases. The July employment report on 7 August showed payrolls contracting. The July consumer price index on 12 August showed inflation continuing to cool. Between them they have taken the September rate hike from the market’s base case to a minority view, and they have done it without a single word of guidance from the Federal Reserve, which under Kevin Warsh has made the absence of guidance a matter of doctrine.
This is the second complete reversal in the September trade this summer. In early July the hike was dead, killed by a soft jobs number. By the middle of the month it was back at roughly two-to-one odds after the minutes and an oil shock. It is now dying again. A policy path that has changed direction three times in six weeks is not a forecast. It is a market with no anchor, reacting to each data point as though it were the only one.
What the July Print Actually Said
The headline number met consensus precisely: 0.1 per cent on the month, 3.4 per cent on the year, down from 3.5 per cent in June. Core inflation, which strips out food and energy, rose 0.2 per cent on the month and 2.5 per cent on the year, a tenth lower than June and the softest annual core reading of this cycle.
Shelter, which carries roughly a third of the index, rose just 0.1 per cent and accounted for around two thirds of the entire monthly increase. That combination tells you how little else moved. Within shelter, owners’ equivalent rent and primary rents both rose 0.3 per cent, while lodging away from home fell 2.8 per cent as the World Cup travel surge unwound. Food rose 0.1 per cent, with groceries actually falling 0.1 per cent and restaurant prices rising 0.3 per cent.
| Component | July m/m | July y/y |
|---|---|---|
| All items | +0.1% | +3.4% |
| Core (ex food and energy) | +0.2% | +2.5% |
| Energy | -1.5% | +14.7% |
| Petrol (all types) | -2.9% | +24.6% |
| Shelter | +0.1% | +3.2% |
| Food | +0.1% | +3.0% |
| Services less energy services | +0.2% | +3.0% |
| Core goods | +0.2% | +0.8% |
| Used cars and trucks | +0.4% | -1.9% |
| Airline fares | +2.2% | +25.5% |
| Medical care | +0.4% | +1.7% |
Two lines in that table deserve more attention than they will get. Core goods rose 0.2 per cent on the month, a re-acceleration after months of near-zero readings, with tariff pass-through visible in motor vehicle parts and a notable jump in computers and smartphones. And airline fares rose 2.2 per cent, leaving them 25.5 per cent higher than a year ago, which is a jet fuel story rather than a demand story. Neither is large enough to change the headline. Both are the sort of thing a hawkish committee member points to when arguing that the underlying picture is less benign than the top line.
The Base Effect Doing the Heavy Lifting
Strip the annual rates back to their components and the shape of this disinflation becomes clearer. Energy is still running at 14.7 per cent year on year and petrol at 24.6 per cent. Those are the residue of the spring oil shock, and they are the reason headline inflation sits at 3.4 per cent rather than somewhere close to core.
The monthly energy decline of 1.5 per cent, following a 5.7 per cent fall in June, is what has been dragging the headline down. That is a welcome development for households and a genuine easing of the cost of living. It is a less useful signal for monetary policy, because it reflects a commodity price rolling over rather than domestic demand cooling. Brent traded around 88 dollars on the day of the release, well below its summer peak but well above where it started the year, and the Strait of Hormuz situation remains unresolved. An energy contribution that has been subtracting from the index can begin adding to it again without any change in the underlying inflation process.

The cleaner read is services excluding energy, running at 3.0 per cent annually and 0.2 per cent monthly. Within that, the so-called supercore measure of services excluding shelter is now running around 2.8 per cent, down close to a percentage point in two months. That is real progress on the component of inflation most closely tied to wages, and it is the number that ought to matter most to a committee worried about second-round effects.
Why September Rate Hike Odds Moved So Far, So Fast
The scale of the repricing is out of proportion to the size of the data surprise, and that is the most interesting feature of the past eight days. The July CPI headline landed exactly on consensus. Core was in line to marginally soft. On its own, a print that matches expectations should move very little.
What moved was the interpretation, and the interpretation had already been rewritten five days earlier by the labour market. Going into the 7 August employment report, futures priced roughly a 55 per cent chance of a September hike. By the close that day the figure was 44 per cent. It drifted back to around 48 per cent by Tuesday 11 August as the market wondered whether a single bad jobs number was noise. The CPI print removed the last argument for a hike: if the labour market is contracting and inflation is not accelerating, there is no case to make. By late morning on 12 August the implied probability of a hike had fallen to roughly 38 per cent, and the probability of a hold had risen to 64 per cent from 52 per cent the day before.
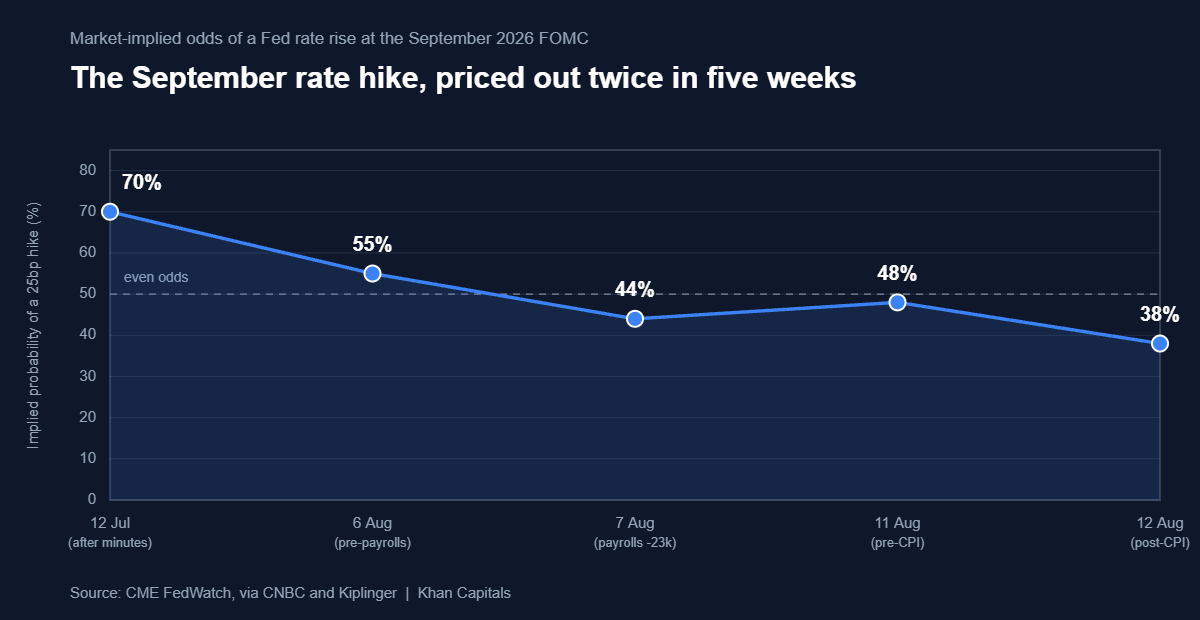
This is what happens to a rates market that has lost its forward guidance. Under the previous regime, a committee that wanted to hike in September would have said so, and the data would have been graded against a known intention. Warsh has deliberately withdrawn that scaffolding. The result is that every release is a referendum, and pricing swings by ten points on numbers that would once have moved it by two.
The Labour Market Is the Real Argument
Payrolls fell by 23,000 in July against an expected gain of 85,000, and the revisions were worse than the headline. May was cut by 66,000 to a gain of 63,000; June was cut by 37,000 to a gain of just 20,000. That is 103,000 jobs removed from the record in a single release, and it turns a picture of slow hiring into one of stalled hiring.
The composition complicates the story in the Fed’s favour. Government employment fell 53,000, with local government education alone down 50,000, a figure that carries an obvious seasonal-adjustment health warning. Private payrolls actually rose by around 30,000. Leisure and hospitality shed 40,000, retail 19,000 and financial activities 14,000, while health care added 22,000, well below its twelve-month average. The unemployment rate edged down to 4.1 per cent from 4.2 per cent, but it did so partly because participation fell to 61.4 per cent, down 0.7 percentage points since January and, outside the pandemic period, the lowest in half a century. Temporary layoffs rose 153,000 to 921,000.
A hawk can argue, credibly, that a labour market shedding public sector education jobs while private payrolls still grow is not a labour market in trouble. A dove can argue, equally credibly, that a falling participation rate and rising temporary layoffs are exactly what the early stage of a downturn looks like. Both readings survive this data. That ambiguity is why the market has moved to a hold rather than to a cut: 62 to 64 per cent odds of no change is not conviction, it is the absence of a reason to act.
A Committee That No Longer Speaks With One Voice
The triple dissent in July was not a procedural curiosity. Hammack said she was not confident inflation would return to target on its own. Kashkari said the time had come to start moving rates up slowly. Logan wanted policy modestly tighter. Three regional presidents putting their names to a hike in the same meeting is a signal about where the internal debate sits, and none of them has spoken publicly since the jobs and inflation data landed.
Warsh, for his part, framed the disagreement as intentional at the July press conference, saying he had asked for a good family fight and got one. He also cautioned that five years of above-target inflation cannot be cured in nine weeks or by a single month of modest price decreases. Two months of decreases have now arrived, which is not the same as a cure, and the Chair’s own framing suggests he will want considerably more than that before declaring the job done.
The only committee voice heard during the window between the two releases was Austan Goolsbee, who said on 11 August that the biggest problem facing the economy was not collapsing jobs but prices rising too fast, and characterised the labour market as stable without being good. Coming from one of the committee’s more dovish members, that is a reminder of how far the inflation-first framing has spread.
What the Bond Market Did Not Do
The most instructive reaction on 12 August was the one that barely happened. The ten-year Treasury yield finished around 4.66 per cent, a couple of basis points lower on the day. The two-year, the maturity most sensitive to the policy path, fell around three basis points to roughly 4.19 per cent. The thirty-year edged down a basis point to 5.23 per cent.
A market that has genuinely removed a rate hike from its expectations should see the front end rally considerably harder than three basis points. The muted move says the bond market is treating the September repricing as provisional. It has taken the hike off the table for one meeting, not repriced the path. The long end, meanwhile, remains stubbornly elevated: a thirty-year at 5.23 per cent alongside two-year yields at 4.19 per cent describes a curve where the term premium, not the policy rate, is doing the work. As one strategist put it after the print, the committee appears content to let the bond market enforce whatever tightening is required.
Equities were similarly restrained. The S&P 500 closed up 0.3 per cent at 7,748.50, the Nasdaq Composite gained 0.5 per cent and the Dow slipped fractionally. That leaves the index just below the record close of 7,757.64 set on 7 August, the day the payrolls number landed. A market that rallies on a jobs contraction and then does almost nothing on a benign inflation print is a market where policy expectations, not earnings, are setting the tone.
Investor Implications
In equities, the repricing is a relief rather than a catalyst. The market spent late July digesting the possibility of a hike into an already extended rally; that possibility has now receded, which removes a discrete risk without adding a new support. The sectors most sensitive to the front end, particularly rate-sensitive small caps and the more speculative end of technology, have the clearest arithmetic benefit. But the index is within a few points of a record, and the argument that got it there was AI earnings rather than monetary policy. A hold in September changes the discount rate assumption at the margin; it does not change the capex cycle that the summer earnings season put under the microscope.
In fixed income, the more interesting question is the shape of the curve rather than its level. Two-year yields around 4.19 per cent embed a policy rate that stays roughly where it is. Thirty-year yields above 5.2 per cent embed something else entirely: a demand for compensation to hold duration that has not eased despite two consecutive benign inflation prints. If the September hold is confirmed and the long end does not follow the front end lower, that gap is the market telling you it is worried about supply and fiscal trajectory rather than about the next policy move.
Across assets, the notable feature is how little the dollar and credit moved. Investment grade spreads sit near the tightest levels in two decades, and a softer policy path is, on the face of it, supportive. But spreads that tight have very little room to reward good news and considerable room to punish a growth disappointment. A labour market that has stopped adding jobs is precisely the sort of development credit at 74 basis points is not compensating anyone for. The equity market read the July data as a policy relief; the credit market, if it is thinking clearly, should read the same data as a growth warning.
| September scenario | What would have to happen | Likely market response |
|---|---|---|
| Hold (market base case) | August payrolls stabilise near zero to modestly positive; August core CPI at or below 0.2% | Limited front-end move; attention shifts to the long end and the December meeting |
| Hike of 25bp | Energy pushes headline back toward 3.7%; core services re-accelerate; payrolls rebound sharply | Sharp two-year selloff; equity multiple compression concentrated in long-duration growth |
| Hold with hawkish framing | Data mixed; dissenters hold their position and the vote splits again | Curve flattening as the front end prices optionality both ways |
| Cut discussion emerges | A second consecutive negative payrolls print on 4 September | Front end rallies hard; credit spreads widen on growth rather than policy |
What to Watch
- 13 August: July producer prices, the first read on whether goods disinflation is holding at the wholesale level, alongside weekly jobless claims.
- 14 August: July retail sales and the preliminary University of Michigan sentiment survey for August, which carries the consumer inflation expectations series the committee watches closely.
- 27 to 29 August: the Kansas City Fed’s Jackson Hole symposium, the most likely venue for Warsh to frame the September decision without formally guiding it.
- 28 August: the BLS preliminary benchmark revision to establishment survey data, an under-covered release that has repeatedly reshaped the labour market picture.
- 4 September: the August employment report. A second consecutive negative print would change the conversation from holds to cuts.
- 11 September: August CPI, the last inflation reading before the committee votes.
- 15 to 16 September: the FOMC decision, accompanied by a Summary of Economic Projections.
Conclusion
The market has spent eight days converting a hawkish committee into a passive one, on the strength of one employment report and one inflation print that matched expectations. That is a great deal of conviction to extract from a modest amount of information, and the speed of the move says more about the vacuum left by the withdrawal of forward guidance than it does about the state of the American economy.
What is genuinely established is narrower than the pricing suggests. Core inflation is at its lowest annual rate of the cycle. Services inflation excluding shelter is falling meaningfully. Hiring has stalled, though the composition of the stall is ambiguous. Set against that, headline inflation remains 1.4 percentage points above target, energy is still 14.7 per cent higher than a year ago, three committee members wanted to raise rates a fortnight ago, and two employment reports and one inflation report arrive before anyone has to decide anything.
The September rate hike odds that collapsed this week were never a forecast of Fed behaviour. They were a running tally of how the last data point felt. On current evidence that tally will be rewritten at least twice more before 16 September, and investors positioning around it would do well to treat it as a sentiment reading rather than a policy signal.
Frequently Asked Questions
What were the September rate hike odds after the July CPI report?
By late morning on 12 August 2026, futures markets implied roughly a 38 per cent chance that the Federal Reserve raises rates at its September meeting, with the probability of no change rising to about 64 per cent from 52 per cent the previous day. Those odds had stood at around 55 per cent for a hike before the July employment report on 7 August.
Why is headline inflation still 3.4 per cent when core is 2.5 per cent?
The gap is energy. Core inflation excludes food and energy, and energy prices remain 14.7 per cent higher than a year ago after the spring oil shock, with petrol up 24.6 per cent. Energy prices have been falling month to month, which is pulling headline inflation down, but the annual comparison stays elevated until those earlier increases drop out of the calculation.
Did the July jobs report really show the economy losing jobs?
Nonfarm payrolls fell by 23,000 in July, and revisions removed a further 103,000 jobs from the May and June figures. The composition matters, though: government employment fell 53,000, with local government education accounting for 50,000 of that, while private payrolls still rose by around 30,000. The unemployment rate edged down to 4.1 per cent, partly because labour force participation fell to 61.4 per cent.
When does the Federal Reserve next decide on interest rates?
The Federal Open Market Committee meets on 15 and 16 September 2026, with the decision announced on 16 September alongside a Summary of Economic Projections. Before then the committee will see the August employment report on 4 September and the August consumer price index on 11 September, both of which are capable of moving expectations substantially.
Why did three Fed officials vote against the July decision?
Beth Hammack, Neel Kashkari and Lorie Logan each preferred to raise the target range by a quarter point at the July meeting. Their stated concerns were that inflation might not return to the 2 per cent target without further action, and that after more than five years of above-target inflation a proactive increase would reduce the risk of second-round effects becoming entrenched. It was the first time since September 2016 that three policymakers dissented in the same direction.
Sources: Bureau of Labor Statistics, Consumer Price Index Summary, July 2026; Bureau of Labor Statistics, The Employment Situation, July 2026; CNBC, five key takeaways from the July CPI report; Kiplinger, July CPI report and September rate-hike odds; RBC Economics, US July CPI analysis; CNBC, July 2026 FOMC decision; Reuters via Kitco, Goolsbee remarks, 11 August 2026; Federal Reserve, FOMC calendar.
Related Reading: the September hike was pronounced dead once already this summer before returning at two-to-one odds, a reversal we traced in The Hike That Came Back. The committee’s internal split was laid bare by the first unified triple dissent in a decade, and the previous inflation print offered a ceasefire dividend the Fed declined to bank. For the market context into which this week’s data landed, see our recap of the week the melt-up met a shrinking jobs market and our analysis of credit spreads at record tights. For the fundamentals, start with how an inflation print moves markets and what the US jobs report actually measures. The demand-side sequel arrived with July’s retail sales fall, and the market response in the small-cap rotation week. The long end delivered its own verdict in the global bond selloff of August 2026. The consumer data behind these odds is tested in retail earnings week. The sanctions package that followed, and the oil market’s refusal to react to it, is covered in the economic D-Day announcement. The stage all of this sets is examined in our preview of Warsh’s first Jackson Hole keynote. The sequel, in which hot PCE and Warsh’s Jackson Hole warning put the hike back on the table, is in the day the tightening question reopened. The supply-shock side of the inflation problem is covered in the Black Sea grain crisis. The metal’s answer to all of it is charted in the gold price rally. The sequel arrived a month later: August payrolls tripled forecasts and revised July’s decline away. The tightening turn has since gone global; see the ECB’s September rate hike.

Leave a Reply