

Khan Capitals | July 2026
Key Takeaways
- The headline index fell 0.4 per cent on the month, the largest one-month decline since April 2020, pulling annual inflation to 3.5 per cent from 4.2 per cent in May, according to the Bureau of Labor Statistics.
- Energy did almost all of the work. The energy index fell 5.7 per cent and petrol fell 9.7 per cent, and the BLS notes energy was the largest contributor to the monthly decline, more than offsetting increases in shelter and food.
- The quieter story is that core inflation is close to target. Core was unchanged on the month and 2.6 per cent on the year, with shelter up just 0.1 per cent, the softest monthly reading in this series.
- Kevin Warsh declined to accept the win. Testifying as the print landed, the Fed chair said some would look at the data and conclude “mission accomplished, everything is swell”, adding: “That is not my view.”
- The disinflation is already dated. June’s petrol relief reflects a truce that broke in early July, and September hike odds sit near 63 per cent having been above 75 per cent the day before the print.
Part of: The Fed’s Regime Change – Khan Capital’s hub on the Fed’s 2026 regime change.
The Best Print in Years, and Nobody Cheered
On paper, 14 July delivered the most encouraging inflation data the United States has seen in a long time. The consumer price index fell 0.4 per cent on the month, a decline not matched since April 2020, when the economy was shut. Annual inflation dropped to 3.5 per cent from 4.2 per cent, a three-year high set only a month earlier. Economists had expected a fall of 0.2 per cent and an annual rate of 3.8 per cent. Core inflation, which strips out food and energy, was flat on the month and slowed to 2.6 per cent on the year against a 2.9 per cent consensus. Every number came in better than the market asked for.
The reaction was not celebration. It was hedging. The reason sat in the composition of the print rather than its headline, and it was made explicit within hours by the man who has to act on it.
The timing was almost theatrical. The data landed on the morning Kevin Warsh, whose term as Fed chair began on 15 May, gave his first semiannual testimony to the House Financial Services Committee, with the Senate Banking Committee following a day later. Asked to interpret the figures, he refused the obvious reading. “There might be some that look at this morning’s data and say, ‘Oh, mission accomplished, everything is swell,’” he told the committee. “That is not my view.”
What the June CPI Report Actually Measured
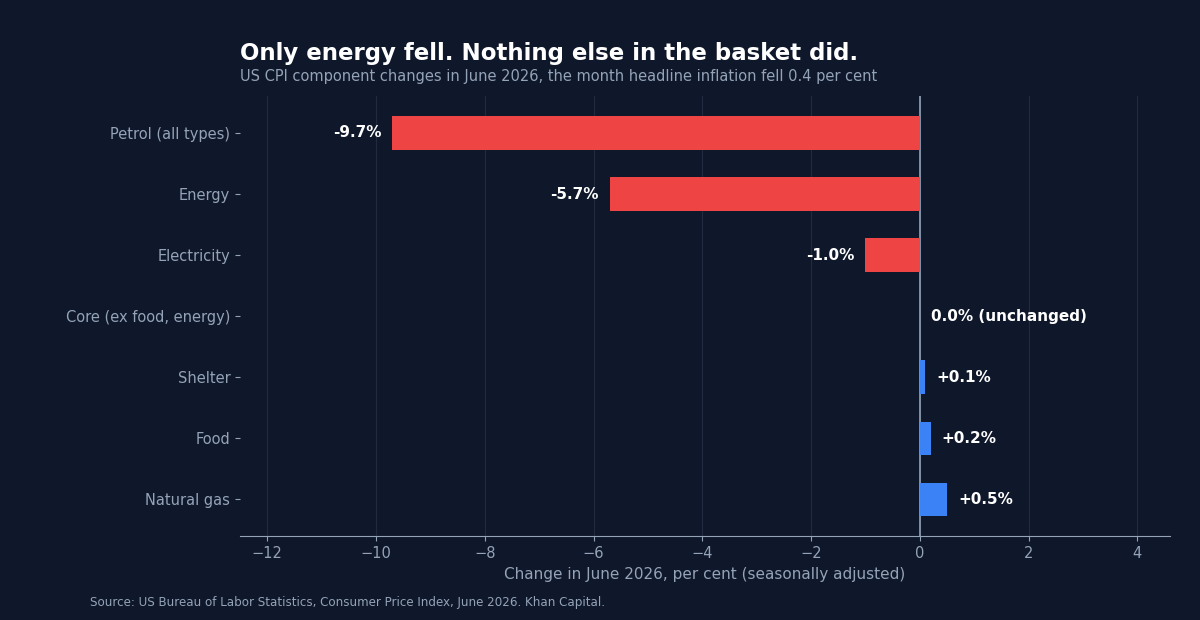
Strip the June CPI report into its parts and the apparent victory narrows to a single commodity. The energy index fell 5.7 per cent over the month, its largest one-month decline since April 2020. Within it, petrol fell 9.7 per cent and electricity fell 1.0 per cent, while natural gas rose 0.5 per cent. The BLS is unusually direct about the arithmetic: energy was the largest contributor to the monthly decline in the all items index, and it more than offset increases elsewhere, including shelter and food.
That last clause is the one worth pausing on. Nothing else fell. Food rose 0.2 per cent, as it did in May. Shelter rose 0.1 per cent. The index for all items less food and energy was unchanged rather than negative. A headline print of minus 0.4 per cent was produced by one component moving violently in one direction while the rest of the basket carried on rising slowly. Read as a statement about the cost of living, June was a month in which almost everything got slightly more expensive and filling a car got much cheaper.
On a twelve-month view the energy component tells the same story in reverse. Energy is still up 15.7 per cent on the year and petrol is up 26.7 per cent. June did not undo the shock. It interrupted it.
| Component | May, month on month | June, month on month | 12 months to June |
|---|---|---|---|
| All items | +0.5% | -0.4% | +3.5% |
| All items less food and energy | +0.2% | 0.0% | +2.6% |
| Energy | +3.9% | -5.7% | +15.7% |
| Petrol (all types) | +7.0% | -9.7% | +26.7% |
| Shelter | +0.3% | +0.1% | +3.3% |
| Food | +0.2% | +0.2% | +3.0% |
The Mirror Image of March
To see why the Fed is unimpressed, run the monthly series backwards. In March the all items index rose 0.9 per cent, the month that turned the 2026 inflation scare from a forecast into a fact. Energy rose 10.9 per cent that month and petrol rose 21.2 per cent. In April, headline rose 0.6 per cent with energy up 3.8 per cent. In May, headline rose 0.5 per cent with energy up 3.9 per cent. Then June: headline minus 0.4 per cent, energy minus 5.7 per cent.
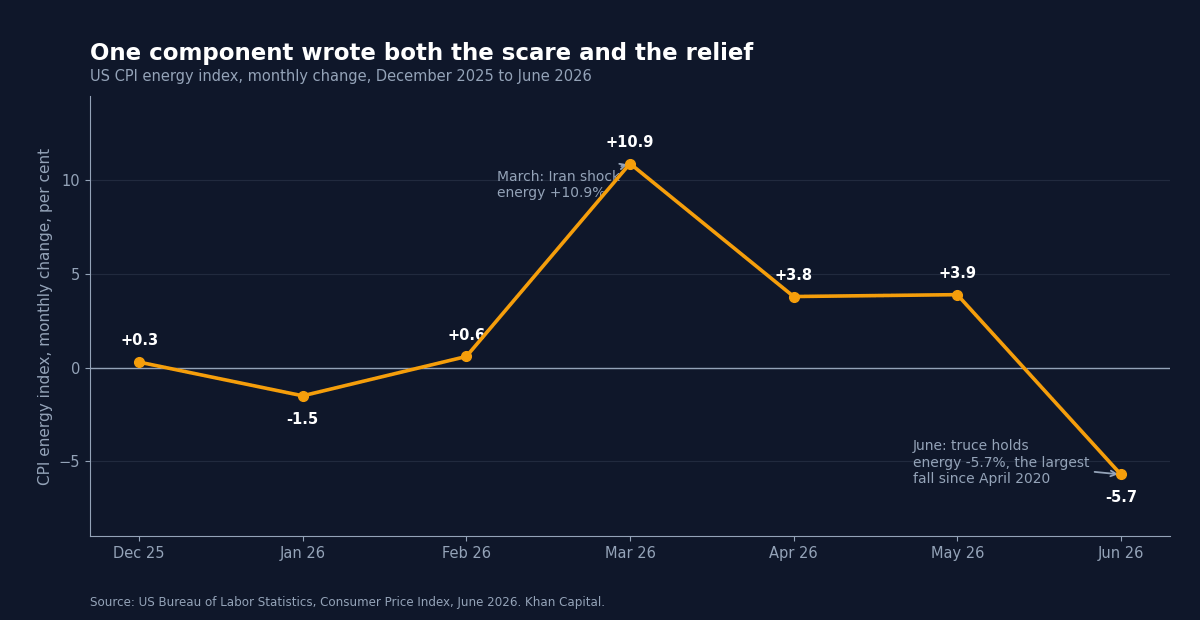
Four consecutive months in which the headline number was, to a first approximation, a function of the oil price. The scare and the relief share a single author. This matters because a central bank cannot claim credit for the second without accepting blame for the first, and it cannot treat either as evidence about the thing it actually controls. Monetary policy does not set the price of crude; it sets the price of money, and it works on the components that respond to the price of money over quarters and years.
What makes the mirror uncomfortable rather than merely tidy is that the reflection has already moved. The petrol relief captured in June reflects the collapse in crude that followed the interim US and Iran calm. That calm did not survive the first week of July. On 8 July three tankers were struck in the Strait of Hormuz and the truce broke, and by the middle of this week crude had traded back above $80. The June CPI report is therefore a photograph of an energy market that no longer exists.
The Part That Was Not Energy
It would be easy to stop there and dismiss the print as noise. That would be a mistake, and it is where most of the commentary this week has been too quick.
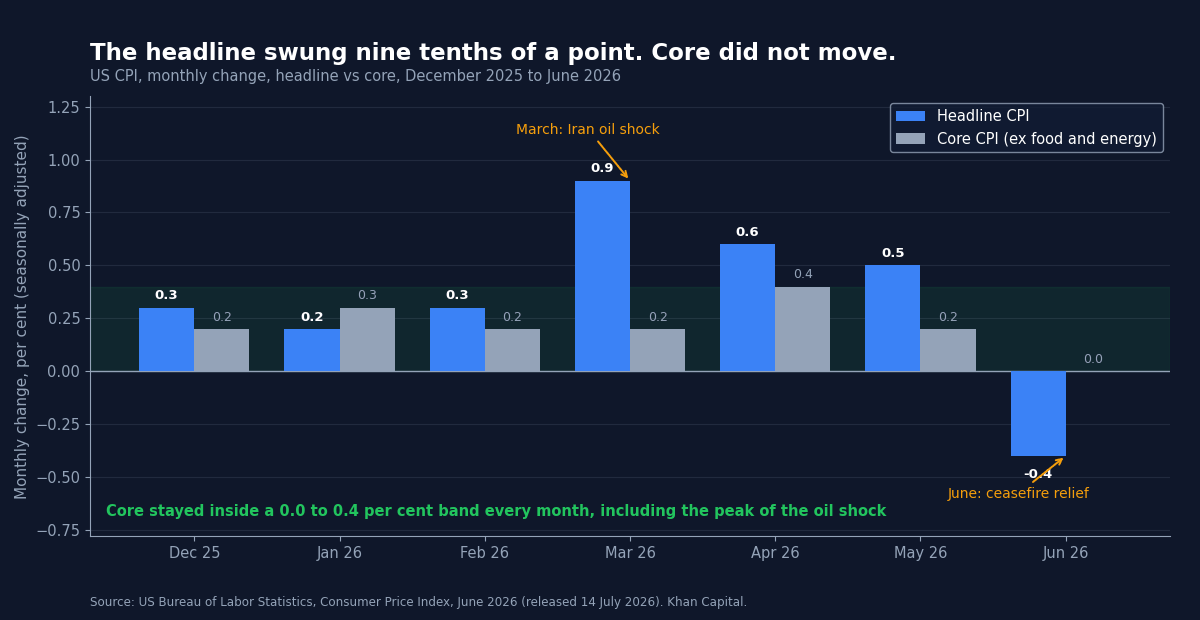
Underneath the energy theatre, the core measure has been quietly well behaved all year. The monthly core readings since December run 0.2, 0.3, 0.2, 0.2, 0.4, 0.2 and 0.0 per cent. Through the worst of the oil shock, in the months when the headline was printing 0.9 and 0.6 per cent, core never exceeded 0.4 per cent. That is the signature of a shock that stayed in the pump price rather than passing through into wages, rents and services. The feared second-round effects, the mechanism that turns an energy spike into an inflation regime, have not shown up in the data.
Shelter is the strongest evidence for that view. It is the largest and stickiest component of the core, it responds to policy with long lags, and it rose just 0.1 per cent in June against 0.6 per cent in April and 0.3 per cent in May. Its annual rate is 3.3 per cent and falling. Alongside it, the June detail shows outright monthly declines in motor vehicle insurance, communication, apparel, medical care, and used cars and trucks. That is a broad list, and it is not the shape of an economy with an entrenched inflation problem.
Set against the 3.4 per cent core PCE reading that underwrote the hawkish turn in June, a core CPI of 2.6 per cent is a materially different picture. The two measures are constructed differently and the gap between them is normal, but the direction is not in dispute.
Why Warsh Would Not Take the Win
A chair looking for cover to stop tightening had it handed to him on the morning of his first testimony. He declined it, and the logic is defensible on its own terms.
The first reason is that the improvement is in the component he cannot influence and does not target. Declaring victory on the back of a petrol price is precisely the error the institution spent 2021 and 2022 being criticised for in reverse, when it looked through an energy and goods shock that turned out to be broader than it appeared. Having been wrong by dismissing a rise, the Fed is unlikely to be enthusiastic about being right by embracing a fall.
The second is that the credibility of a new chair is established in the first six months. Warsh arrived with a hawkish reputation, held rates at his first meeting in a way the market read as a hike, and has spent his early tenure retiring forward guidance. A chair who celebrates a data point that flatters him invites the market to price him as data-chasing rather than regime-setting.
The third reason is the calendar. Crude was back above $80 as he spoke. He knows what that does to the July print, which arrives in mid-August, and he has no interest in explaining a re-acceleration he had blessed a month earlier.
Two Inflations, One Policy Rate
The result is an awkward position that is likely to define the second half of the year. The United States currently has two inflation rates telling opposite stories. The core rate, at 2.6 per cent, is within touching distance of the target and decelerating, with its stickiest component softening. The headline rate, at 3.5 per cent, is a hostage of the Strait of Hormuz and could plausibly be anywhere between 3 and 5 per cent by the autumn depending on decisions taken in Washington and Tehran.
The Fed targets the first and the public experiences the second. Households do not compute ex-food-and-energy indices; they observe the forecourt. Inflation expectations, which the Fed does treat as a policy-relevant variable, are formed disproportionately by the prices people see most often, and petrol is the most visible price in the economy. That is the bridge by which an energy shock the Fed cannot control becomes an inflation problem the Fed must answer for, and it is why Warsh cannot simply point at core and go home.
The rates market has read this correctly, which is why the reaction was so muted for such a large surprise. A July hike, which was never seriously priced, is now effectively off the table for the meeting on 28 and 29 July. September, however, survived. Odds of a September increase sit near 63 per cent, having been above 75 per cent the day before the print, on the CME’s FedWatch measure. A 0.4 percentage point downside surprise in headline inflation moved the September probability by roughly twelve points and killed nothing. That is the market saying, in the only language it has, that it does not believe June is repeatable.
| Scenario for July CPI | Energy assumption | Likely headline shape | Implication for September |
|---|---|---|---|
| Relief holds | Crude settles back below the June average | A second soft headline; annual rate toward 3% | The hike case weakens materially |
| Round trip | Crude holds near $80 through July | Headline turns positive again; annual rate stalls near 3.5% | September stays live; core becomes the argument |
| Escalation | Hormuz disruption pushes crude higher still | A March-style headline; annual rate back toward 4% | A hike becomes the base case despite soft core |
Investor Implications
For fixed income, the print argues for treating headline inflation as an oil derivative and pricing the policy path off core and the labour market instead. The front end is now trading a September decision that will be made on data published in August, which will itself be dominated by an energy component set in the Gulf. That is an unusually direct link between a geopolitical tape and a rates market, and it implies that the distribution of outcomes for two-year yields is wider than a 2.6 per cent core rate would normally justify.
For equities, the read-across is about which disinflation the market chooses to trade. A core rate at 2.6 per cent with shelter cooling is the environment in which long-duration assets normally do well. A headline hostage to crude, with a chair who will not rule out a hike, is not. Those two descriptions are of the same economy in the same week, and positioning that resolves the tension in either direction is taking a view on the Strait of Hormuz whether or not it intends to.
Cross-asset, the June data reinforces a pattern visible since the spring: energy has become the transmission mechanism through which geopolitics reaches the policy rate, and therefore through which it reaches everything else. That is also why the traditional hedge has behaved so strangely, with gold falling through a geopolitical flare-up because the rate trade overwhelmed the fear trade.
What to Watch
- FOMC, 28 and 29 July: a hike is not expected, so the statement language and any change to how the committee characterises energy will carry the information.
- July CPI, mid-August: the first print to capture crude back above $80. The energy line will determine the headline; the core and shelter lines will determine whether the underlying improvement is real.
- Shelter, every month from here: a second and third monthly reading near 0.1 per cent would be the most important disinflation signal available, and the one least contaminated by the oil price.
- The September meeting, 15 and 16 September: currently near a coin toss weighted to a hike, and the decision most exposed to events in the Gulf between now and then.
Conclusion
The June CPI report will be remembered as the month American inflation fell at the fastest rate in six years and almost nothing changed. It was a good number produced by a truce rather than by policy, and the truce was already broken by the time the number was published. Warsh’s refusal to accept it was not obstinacy; it was an accurate description of what the data can and cannot support.
The more durable finding is the one the headline obscured. Core inflation is at 2.6 per cent and slowing, shelter has cooled to 0.1 per cent on the month, and an oil shock large enough to put headline at a three-year high in May has still not passed through into the parts of the basket that respond to interest rates. On the evidence the Fed says it targets, the case for further tightening is weaker than it was in June. The reason it may tighten anyway has less to do with the American economy than with a waterway 7,000 miles away, and that is an uncomfortable place for a central bank to find itself.
Frequently Asked Questions
What did the June 2026 CPI report show?
The US consumer price index fell 0.4 per cent in June on a seasonally adjusted basis, the largest one-month decline since April 2020, after rising 0.5 per cent in May. Annual inflation slowed to 3.5 per cent from 4.2 per cent. Core inflation, excluding food and energy, was unchanged on the month and 2.6 per cent on the year.
Why did US inflation fall so sharply in June?
Energy did almost all of the work. The energy index fell 5.7 per cent and petrol fell 9.7 per cent over the month, following the easing of the US and Iran conflict. The Bureau of Labor Statistics identifies energy as the largest contributor to the monthly decline, more than offsetting increases in shelter and food. No major component other than energy fell.
Did the June CPI report end the case for a rate hike?
Not for September. Fed chair Kevin Warsh told Congress that some would read the data as “mission accomplished, everything is swell”, and said that was not his view. Market-implied odds of a September increase moved to roughly 63 per cent from above 75 per cent the previous day, which leaves the decision live. A hike at the July meeting is not expected.
Is core inflation now close to the Fed’s 2 per cent target?
Core CPI is 2.6 per cent on the year and was unchanged in June, with shelter, the largest core component, rising just 0.1 per cent on the month. The Fed formally targets PCE inflation rather than CPI, and core PCE was 3.4 per cent when it last printed, so the measures differ. The direction of travel in both is toward the target.
Sources: Bureau of Labor Statistics, Consumer Price Index, June 2026; BLS CPI news release; CNN Business, Warsh testimony and the June inflation print; CNBC, consumer price index inflation report, June 2026; Axios, Warsh’s comments and the rate path; PBS News, Warsh testifies on monetary policy.
Related Reading: The September decision this print did not settle is the subject of the hike that came back, and the repricing that started it is traced in from cuts to hikes. For the other half of the Fed’s mandate, see the June jobs report; for the inflation measure the Fed actually targets, see core PCE at 3.4 per cent; and for the energy shock driving the headline, see the tanker strikes that ended the truce. For the fundamentals, start with how a CPI print moves markets and inflation explained. The waterway driving that headline is the subject of the Strait of Hormuz toll that lasted a day. How the same energy shock reads in Frankfurt is covered in the ECB’s hawkish hold. The trade-policy shock that followed is covered in the US forced labour tariffs. For the meeting where this tension came to a vote, see the Fed’s triple dissent in July. The following month brought a second benign print and a sharp repricing, covered in September rate hike odds collapse. The consumer’s turn arrived with July’s 0.6 per cent retail sales fall.

Leave a Reply